 Laboratory Corporation of America Holdings (LH) is looking bullish as the Moving Average Convergence Divergence (MACD) turns up and Chaikin Money Flow pops.
On the price chart, the long-term trend is up because LH hit a new high in January, the 50-day EMA is above the 200-day EMA and price is above the 200-day EMA.
The stock led the market with a 20+ percent gain from mid-November to late January and then consolidated after the February plunge. A triangle is taking shape and the stock is challenging the upper line already this week.
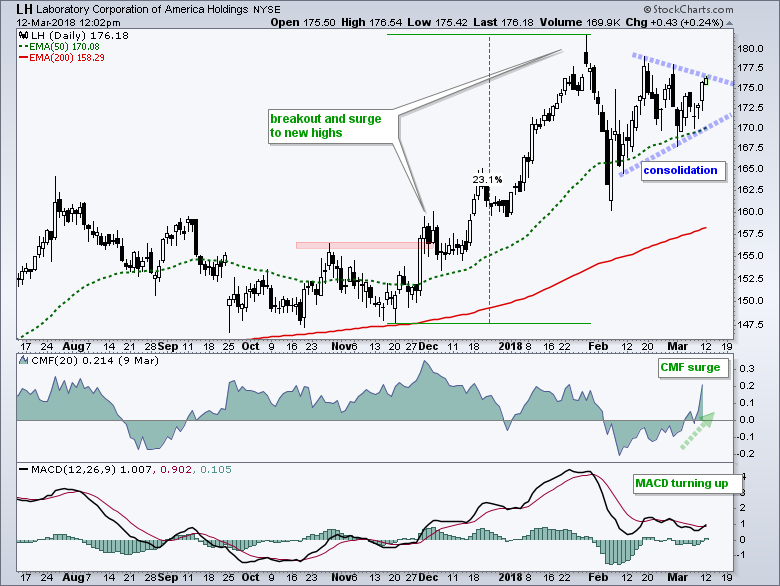
The indicator window shows CMF(20) moving from -.10 to +.20 over the last two weeks. Negative CMF points to distribution, while positive CMF indicates accumulation. The sudden surge in CMF suggests a change from distribution to accumulation.
The indicator window shows MACD turning up and moving above its signal line. Putting is all together, it looks like LH is under accumulation as momentum turns up. A close below 170 would break the triangle line and call for a reassessment.
Plan Your Trade and Trade Your Plan.
- Arthur Hill, CMT
Senior Technical Analyst, StockCharts.com
Book: Define the Trend and Trade the Trend
Twitter: Follow @ArthurHill
