 Apple (AAPL) broke out of a pennant formation with a surge on Friday and this breakout could bode well for Qorvo (QRVO) and Skyworks (SKWS).
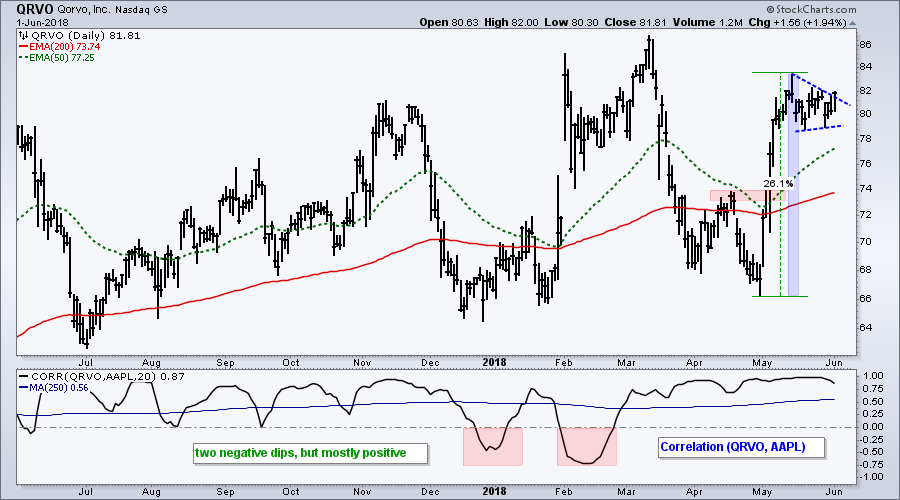
The first chart shows Qorvo surging over 20% and then stalling with a contracting consolidation. This is a pennant and it is a bullish continuation pattern. A breakout would signal a continuation higher and open the door to new highs.
The indicator window shows the Correlation Coefficient so we can compare Qorvo with Apple. There were two dips into negative territory, but these two are positively correlated for the most part, especially since March 2018. Notice that the 250-day SMA of the Correlation Coefficient is currently at +.56.
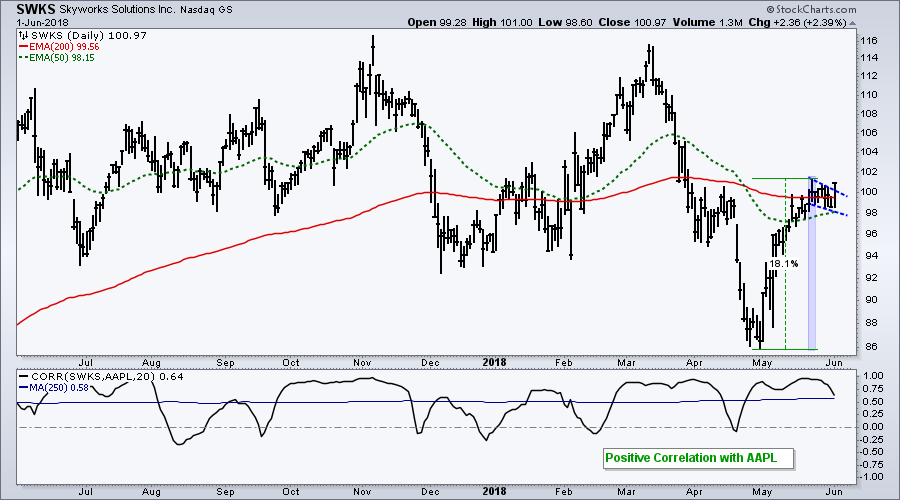
The second chart shows Skyworks (SKWS) with an 18% surge and a small falling flag. The stock broke out of the flag with a surge on Friday and this signals a continuation higher. Chartists can now use the flag lows to mark first support. A close below 98 would call for a re-evaluation.
The indicator window shows the Correlation Coefficient spending most of its time in positive territory and the 250-day SMA near +.58.
On Trend - Available to All
On Trend is my show on StockCharts TV. Available to everyone, this show airs every Tuesday at 10:30 AM and is then archived on our Youtube Channel. StockChartsTV and the video archives are available to everyone.
Highlights from On Trend for Tuesday, May 29th
- What do Trendlines Actually Measure
- Measuring Risk On/Off (Dollar, Gold, Yen, Treasuries)
- Euro Breaks Down and Yen Bounces
- Gold Becomes Oversold within an Uptrend
- Italy and Spain Lead Europe Lower (international index symbols)
- QQQ, Top QQQ Stocks, XLF and XLV
Plan Your Trade and Trade Your Plan.
- Arthur Hill, CMT
Senior Technical Analyst, StockCharts.com
Book: Define the Trend and Trade the Trend
Twitter: Follow @ArthurHill


