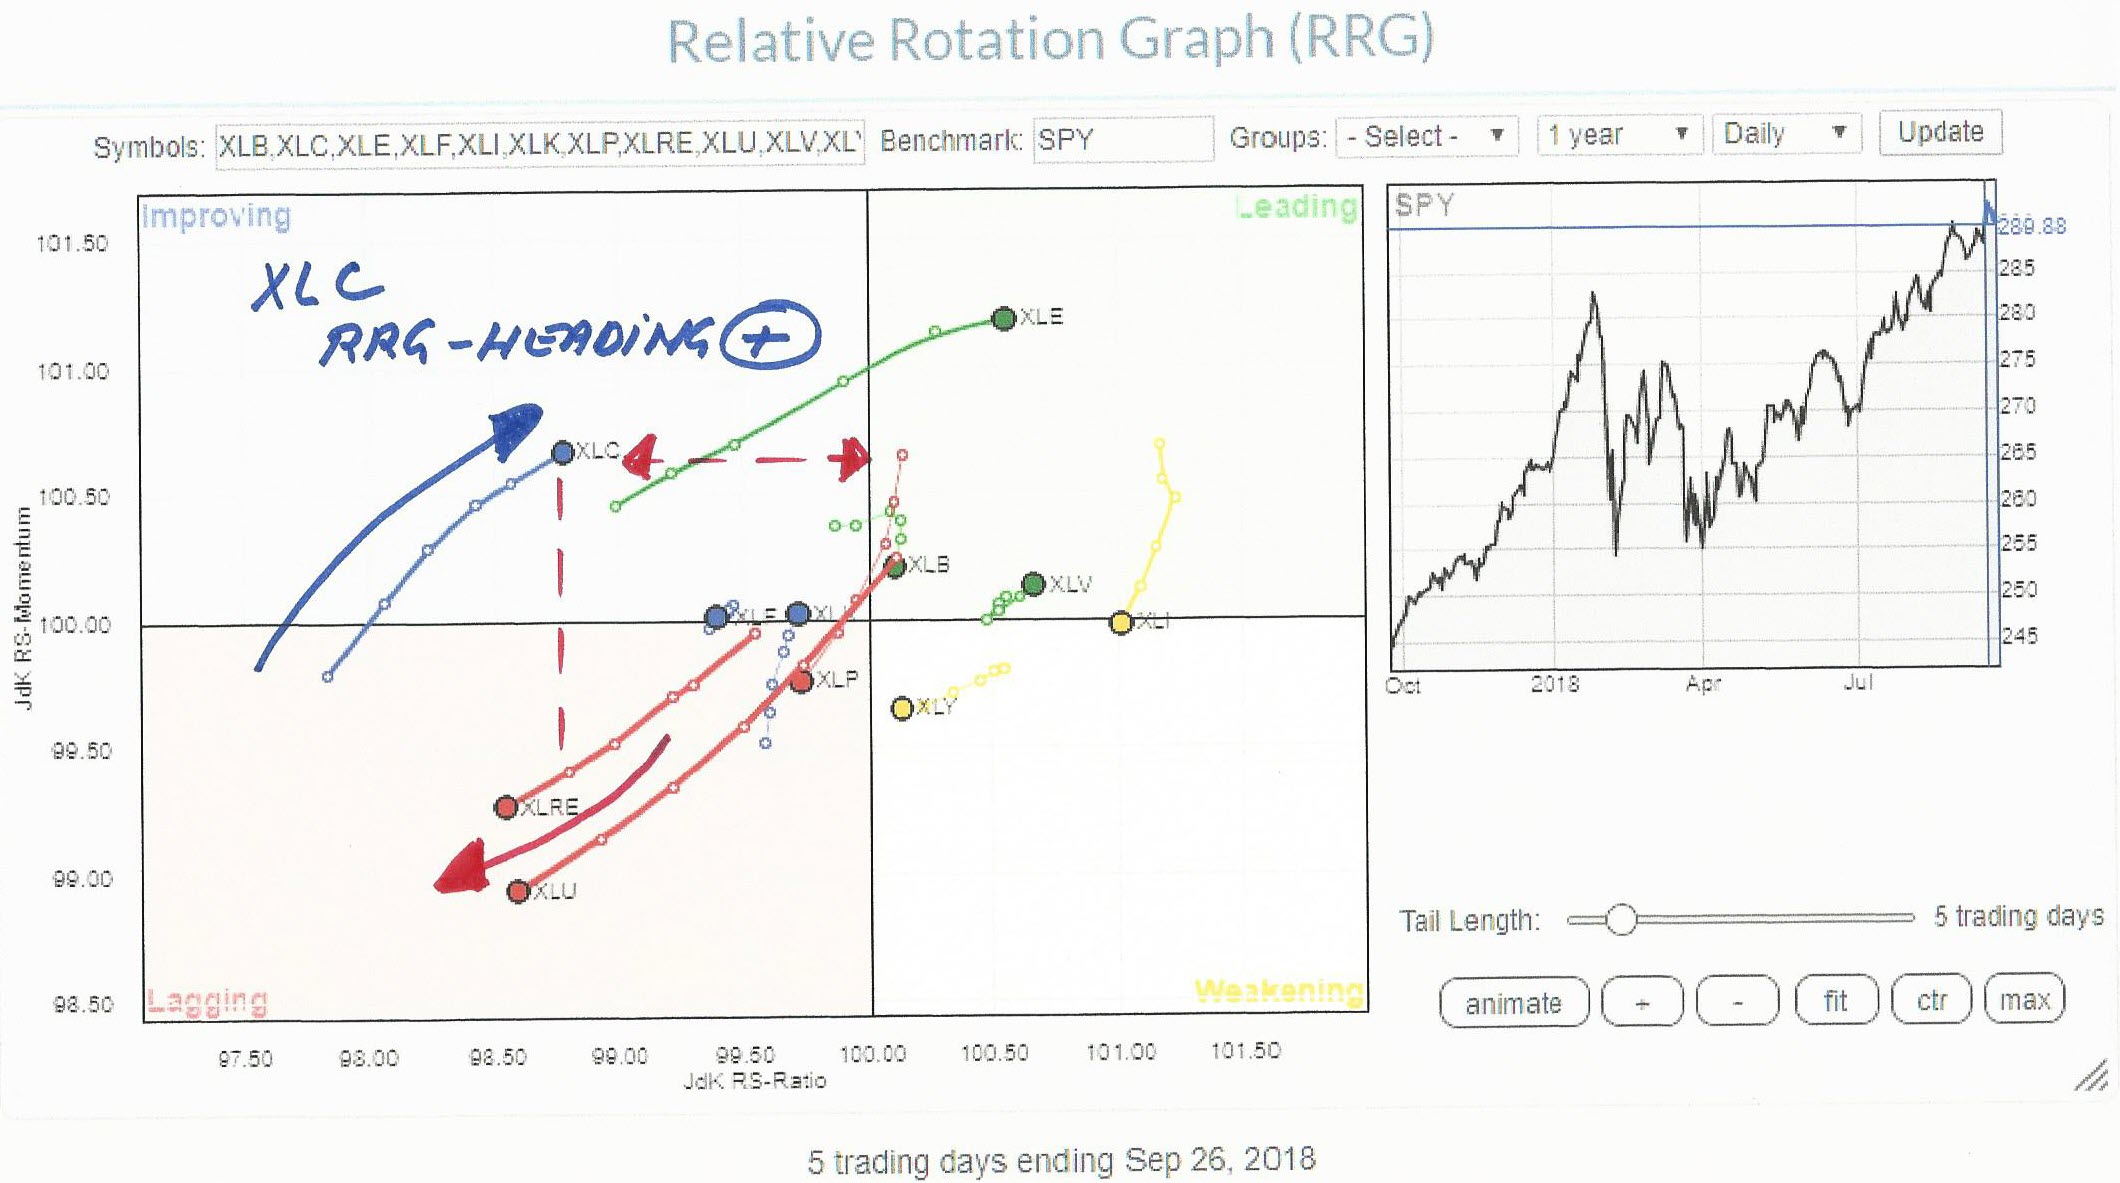
On the daily Relative Rotation Graph above, the new XLC sector is positioned inside the improving quadrant. XLC moved into the improving from lagging 5 trading days ago and is now heading higher on both scales at a positive RRG-Heading.
Measured on the JdK RS-Ratio scale (horizontal axis), XLC is still one of the weaker sectors in the S&P universe with only XLRE and XLU at lower RS-Ratio levels. The big difference is that XLRE and XLU are heading South-West while XLC is heading North-East.
Combining this view of RRG with the weekly version (below) makes clear that there is a good chance that the current positive rotation on the daily RRG will have a hard time completing a rotation into the leading quadrant.
The distance from the 100-level on the RS-Ratio scale is big enough to roll over and complete the rotation through improving and then back to lagging, thus confirming the weak position on the weekly RRG.
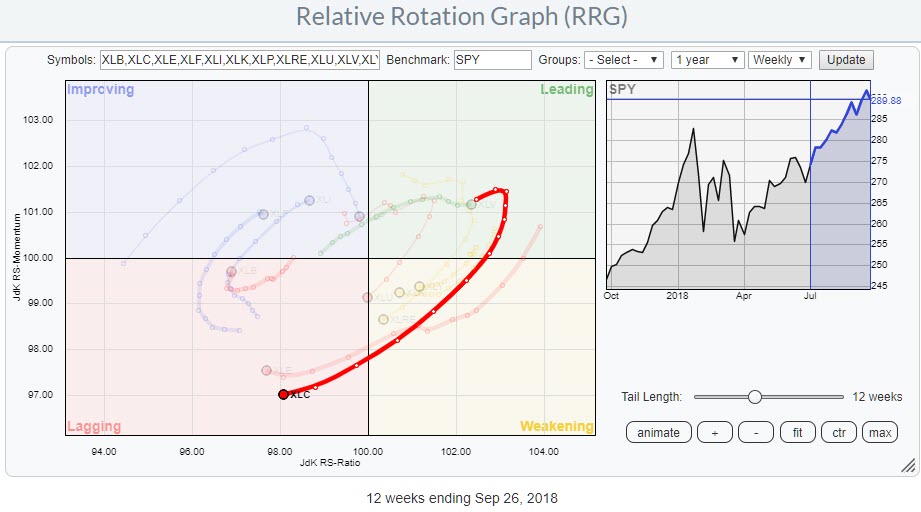
All in all the current relative improvement for the new Communications Services sector seems to be a recovery within a longer term relative downtrend.
Let me know what you think of this usage of RRG in the comments below. If you would like to receive a notification when a new RRG blog article is published, simply "Subscribe" with your email address.
Julius de Kempenaer | RRG Research
RRG, Relative Rotation Graphs, JdK RS-Ratio, and JdK RS-Momentum are registered TradeMarks ®; of RRG Research
Follow RRG Research on social media:
If you want to discuss RRG with me on SCAN, please use my handle Julius_RRG so that I will get a notification.
Feedback, comments or questions are welcome at Juliusdk@stockcharts.com. I cannot promise to respond to each and every message but I will certainly read them and where reasonably possible use the feedback and comments or answer questions.
