 Goldman Sachs is the premier investment bank and a key component of the Financials SPDR (XLF), as well as the Broker-Dealer iShares (IAI). The stock has struggled since March and lagged the market for over six months now. While the S&P 500 moved to a new high in September, Goldman remained below its 40-week moving average and did not come close to its March high. As with this image of their building in New Jersey, something is amiss on this chart.
The chart below shows Goldman moving sharply higher in the third quarter of 2016 and advancing in the third quarter of 2017 (green outlines). We are well into the fourth quarter of 2018 and Goldman is struggling to make a move. The stock hit a new low for 2018 three weeks ago and remains below the 40-week SMA. The indicator window shows the PPO(5,26,0) in negative territory since mind April, which means the 5-week EMA is below the 26-week EMA.
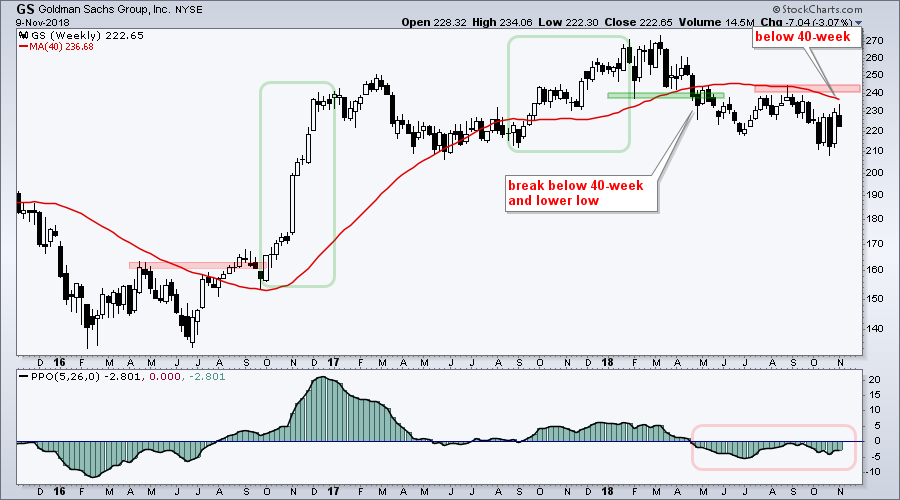
The stock did form two long white candlesticks with large weekly bounces over the last five weeks. However, we have yet to see follow through to these one-week wonders. Look for a break above 40-week SMA for the first sign that Goldman is trying to turn the corner.
Plan Your Trade and Trade Your Plan.
- Arthur Hill, CMT
Senior Technical Analyst, StockCharts.com
Book: Define the Trend and Trade the Trend
Twitter: Follow @ArthurHill


