 A long-term downtrend, two gaps down and a move back below the falling 200-day could spell trouble for L Brands.
The stock has been quite volatile since summer, but the overall trend remains down. LB hit a 52-week low in early September, the 50-day SMA (not shown) is below the 200-day SMA, the 200-day SMA is falling and price is back below the 200-day SMA.
The stock gapped above the 200-day SMA in mid November, but this gap did not hold as the stock gapped down twice. The second gap was back below the 200-day SMA. Even though LB bounced after this gap, the bounce again failed to hold above the 200-day SMA as the stock fell sharply last week.
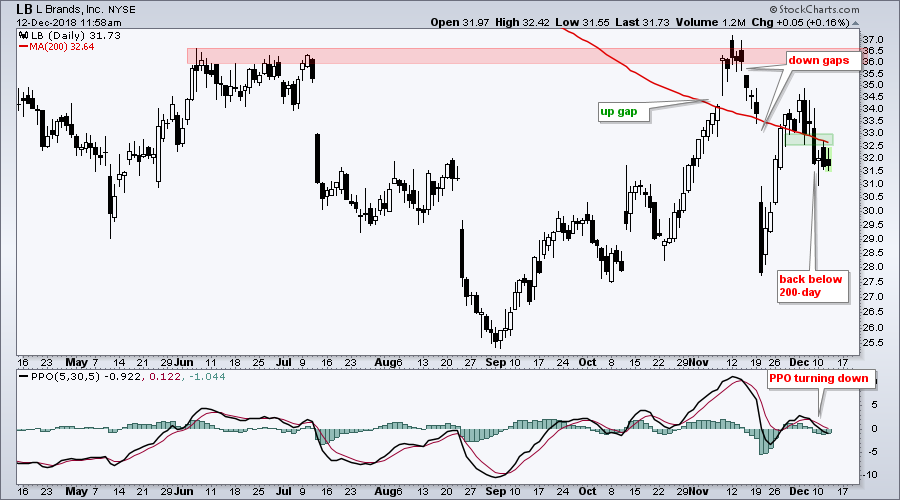
The indicator window shows the PPO (5,30,5) turning down over the last few days and moving back into negative territory. The move below zero means the 5-day EMA is back below the 30-day EMA. Thus, it looks like price is turning back down and the bigger downtrend is resuming.
On Trend on Youtube
Available to everyone, On Trend with Arthur Hill airs Tuesdays and Thursdays at 10:30AM ET on StockCharts TV and repeats throughout the week at the same time. Each show is then archived on our Youtube channel.
Topics for Tuesday, December 11th:
- SPY, MDY and IJR Break Triangle Lines
- XLF, XLI and XLE Lead Sectors Lower
- Finance-related ETFs Weigh (KRE, IAI, KIE)
- Treasuries Remain Strong and Junk Weak
- Some Tech-related ETFs Hold Up, BUT....
- Stocks to Watch (AMZN, HRB, BIIB...)
- href="https://youtu.be/PGu8nGKosTU" target="_blank">Click here to Watch
- Arthur Hill, CMT
Senior Technical Analyst, StockCharts.com
Book: Define the Trend and Trade the Trend
Twitter: Follow @ArthurHill


