 With December complete, chartists can now examine monthly close-only charts for an assessment of the long-term trend and stock market risk. Spoiler: it is not a pretty picture.
Before looking at the chart, let's review the concept behind Price Channels. Chartists can use Price Channels to mark the high-low range over a given lookback period. For example, the 12-period Price Channel on a monthly close-only chart shows the high-low range for closing prices over the previous 12 months, which excludes the current month's high-low range. A monthly close above the Price Channel means the month finished above the closing high of the previous 12 months, while a close below the Price Channel means the month finished below the closing low of the previous 12 months. In essence, a close above the Price Channel signals a 12-month high, while a close below the Price Channel signals a 12-month low.
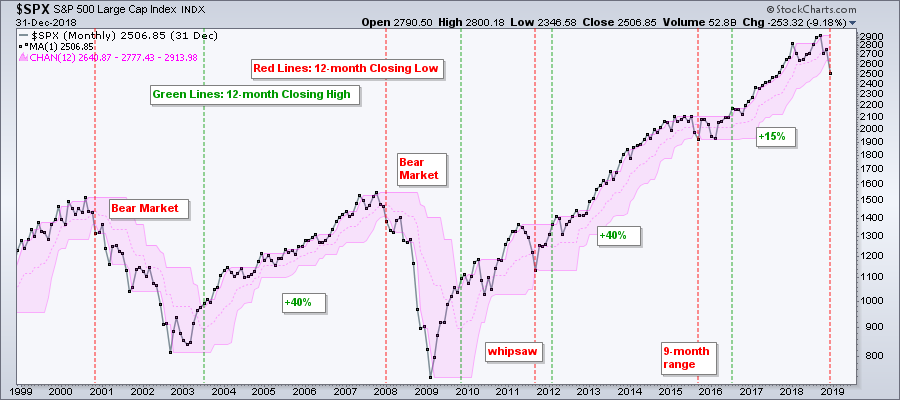
The chart below shows the S&P 500 with monthly closing prices and the 12-month Price Channel. The red lines show when the monthly close is below the lower line of the Price Channel and the green lines show when the monthly close is above the upper line of the Price Channel. As you can see, the index closed below the lower line in December and this confirms the long-term downtrend.
The December close below the lower line is the fifth bearish signal over the last twenty years. The first two signals foreshadowed the bear markets of 2001-2003 and 2008-2009. The third signal resulted in a whipsaw (September 2011) and the fourth signal occurred during a choppy correction (September 2015). Even though not every bearish signal resulted in a bear market, the risk of a bear market is clearly higher after these signals. There were also four bullish signals. Two foreshadowed advances of around 40%, and the last one preceded a 15% advance in the index.
Chartists can use these signals as a general risk assessment of the stock market. The trend is down and risk is high after a bearish signal. Investors should favor low-beta stocks or reduce their exposure to stocks in such environments. The trend is up and risk is low after a bullish signal. Investors should favor high-beta stocks or increase their exposure to stocks in such an environment.
Chartists can plot the shaded Price Channels by selecting "area" as the "style". I set the "opacity" at .3 to make the shading transparent. The image below shows these settings.

On Trend can be see on Tuesdays and Thursdays on StockChartsTV. The shows are then archived on our Youtube channel for on demand viewing.
What to Watch in 2019 (not a forecast!)
- 12 Breadth Indicators to Monitor
- Volatility has Yet to Spike
- Defensive Groups Not Immune
- Treasuries Bid for Big Reversals
- Monitor Trends and Benchmark Levels
- Pockets of Strength to Watch in 2019
- Click here to Watch
- Arthur Hill, CMT
Senior Technical Analyst, StockCharts.com
Book: Define the Trend and Trade the Trend
Twitter: Follow @ArthurHill


