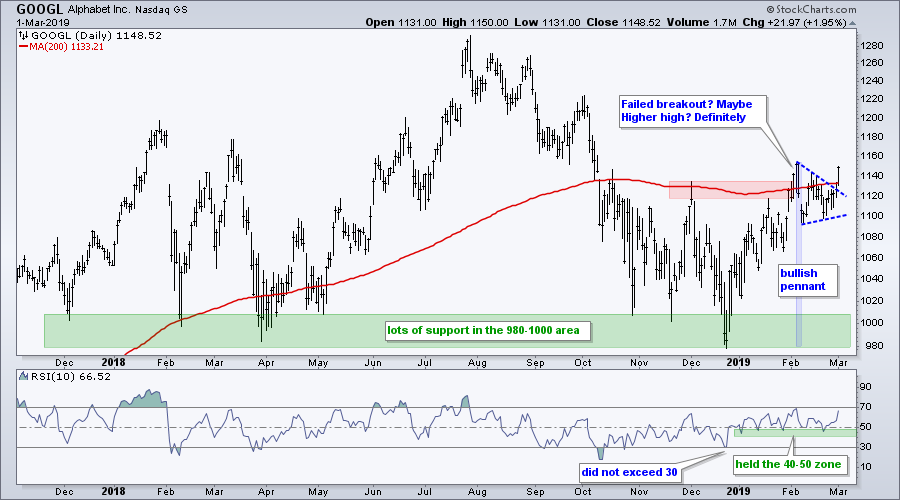
 Google, or rather Alphabet, broke out of a short-term consolidation and this could have long-term implications.
The chart below shows GOOGL hitting support in the 980-1000 area from October to December. This support zone extends back to December 2017 and represents a whole lot of demand. Buyers are clearly active in this zone because the stock continues to hold it.
The most recent bounce of this support zone carried Alphabet above its November high and 200-day SMA. Even though the stock did not hold above this breakout zone, it did forge a higher high by exceeding the early December high. In addition, the stock was up over 15% in less than six weeks and entitled to a rest.
A pennant formed in February and this is a bullish continuation pattern. Notice that GOOGL found support in the 1100 area in February and then broke out of the pennant with a strong move on Friday. This signals a continuation of the prior advance. With the stock above its rising 200-day SMA, this is a bullish development and I would expect a challenge to the summer highs.
Note that Alphabet, Amazon and Apple were featured in Art's Charts with short-term bullish continuation patterns last Wednesday (members only).
On Trend on YouTube
Realistic Expectations for Moving Average Signals
- Testing Various Moving Average Pairs ($SPX)
- Adding Short Positions to the Mix
- A Surprising Pair to Consider
- Trading SPY Long/Short with $SPX Signals
- Identifying Moving Average Turns on SharpCharts
- MACD to Measure an EMA’s Rate-of-Change
- Click here to Watch
- Arthur Hill, CMT
Senior Technical Analyst, StockCharts.com
Book: Define the Trend and Trade the Trend
Twitter: Follow @ArthurHill


