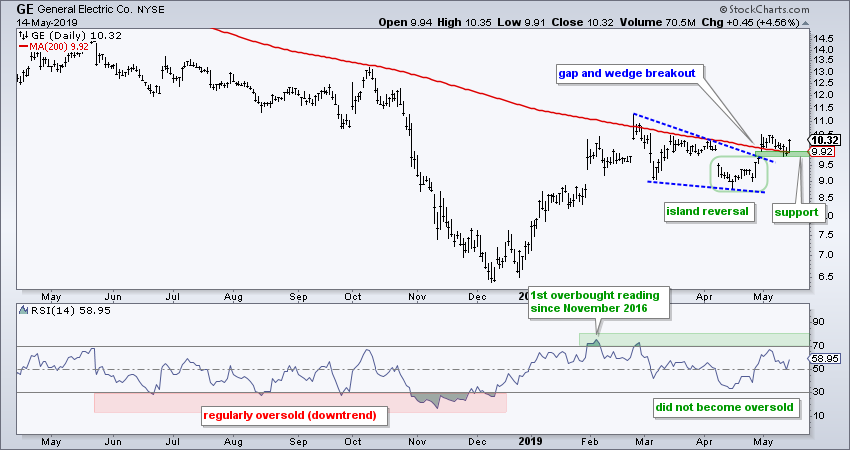
 General Electric (GE) is one of the worst performing stocks over the last two years, but the stock is perking up in 2019 and outperforming in May. The S&P 500 is down 3.8% so far this month and GE is up 1.5% after a big surge on Tuesday.
GE is trying to reverse the long-term downtrend with a move above its 200-day SMA over the last two weeks. The stock broke above this key moving average with a gap up on April 30th and is largely holding above the SMA. The moving average, however, is still falling.
The chart sports a bullish reversal pattern and wedge breakout. First, notice the gap down in mid April and gap up in late April. These gaps overlap to create an island reversal on the chart. GE broke above the wedge line with the second gap and this gap is holding. This breakout signals a continuation of the prior advance with the gap zone now marking first support to watch going forward.
The indicator window shows RSI attempting to shift from a bearish configuration to a bullish configuration. First, notice how RSI became oversold on a regular basis as the stock trended lower. Second, note how RSI moved above 70 for the first time since November 2016. This is the most upside momentum in over two years. Third, notice that RSI did not become oversold on the April dip. Thus, we are clearly seeing more upside momentum than downside momentum this year.
On Trend on Youtube (Tuesday, 14-May)
- Triple 90% Down Volume Day
- Breadth Table Update (still bullish)
- Four Steps up and One Step Back
- SPY Hits Support and Becomes Oversold
- Interest in Tariffs and Fed (Google Trends)
- Click here to Watch
Arthur Hill, CMT
Senior Technical Analyst, StockCharts.com
Author, Define the Trend and Trade the Trend
Want to stay up to date with the latest market insights from Arthur?
– Follow @ArthurHill on Twitter
– Subscribe to Art's Charts
– Watch On Trend on StockCharts TV (Tuesdays / Thursdays at 10:30am ET)


