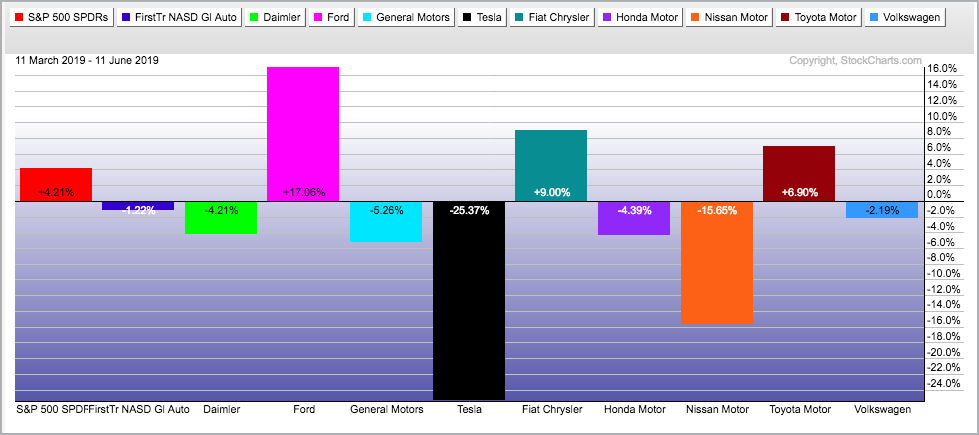
It has been a tough three months for most auto stocks with the Global Auto ETF (CARZ) falling around 1.22%. In contrast, the S&P 500 SPDR (SPY) is up 4.21% since March 11th. Within the group, Ford (F) Daimler-Chrysler (DDAIF) and Toyota (TM) show gains during this period, while the other six show losses. Note that Tesla is by far the biggest loser with a 25% decline.
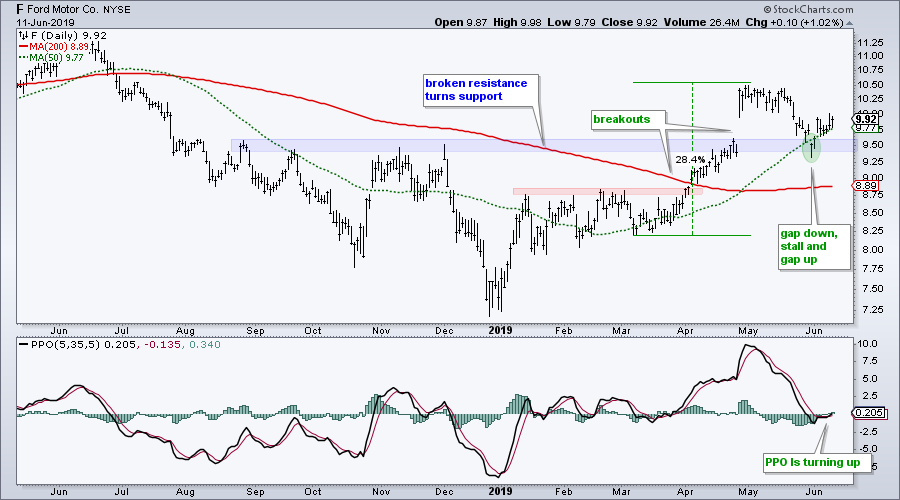
Ford is the clear performance leader and the price chart also looks bullish. First and foremost, the long-term evidence points to an uptrend here. The stock broke above its September-December highs with a surge in April. Ford is also above its 200-day SMA and this moving average is starting to turn up. And finally, notice that the 50-day SMA is above the 200-day SMA.
Short-term, the stock fell back to the breakout zone and filled the late April gap with a decline in May. While the filled gap may seem negative, it is normal to return to the breakout zone and the stock was entitled to a correction after the April surge, which was 28%.
The stock is starting to bounce. Broken resistance turned into support in the 9.5 area as the stock forged a gap-gap reversal last week (green oval). Notice that Ford dipped below the 50-day SMA with the gap and then reversed with a gap-move back above the 50-day. This reversal affirms support in the 9.5 area and a close below 9.5 would call for a re-evaluation.
On Trend on Youtube (Tuesday, June 11th)
- Trend versus Situation (SPY, SOXX)
- XLV Starts to Stand Out
- StockCharts ACP and Top Healthcare Stocks
- Careful where you set your Stops (FFIV)
- Trading the Pattern within the Pattern (CSCO)
- Click here to Watch
Arthur Hill, CMT
Senior Technical Analyst, StockCharts.com
Author, Define the Trend and Trade the Trend
Want to stay up to date with the latest market insights from Arthur?
– Follow @ArthurHill on Twitter
– Subscribe to Art's Charts
– Watch On Trend on StockCharts TV (Tuesdays / Thursdays at 10:30am ET)


