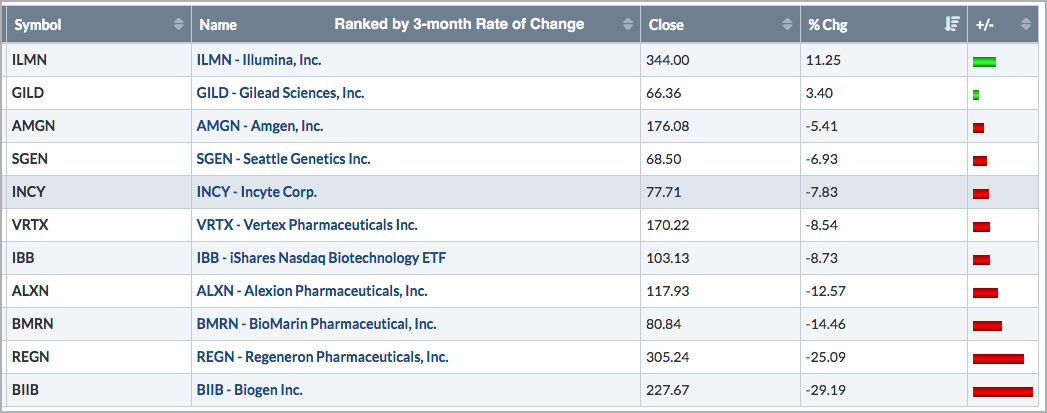
It has been a rough three months for many biotechs and the Biotech iShares (IBB), but Illumina (ILMN) rose above the crowd with a big gain and three month high. The long-term chart also looks bullish.
The table below shows the Biotech iShares and the top ten stocks (sans Celgene) ranked by the 3-month Rate-of-Change. I left out Celgene because it is being acquired by Bristol Meyers (BMY). Notice that IBB is down 8.73% and eight of the top ten stocks are down. Gilead (GILD) is up a little and Illumina (ILMN) is the runaway leader with an 11.25% gain.

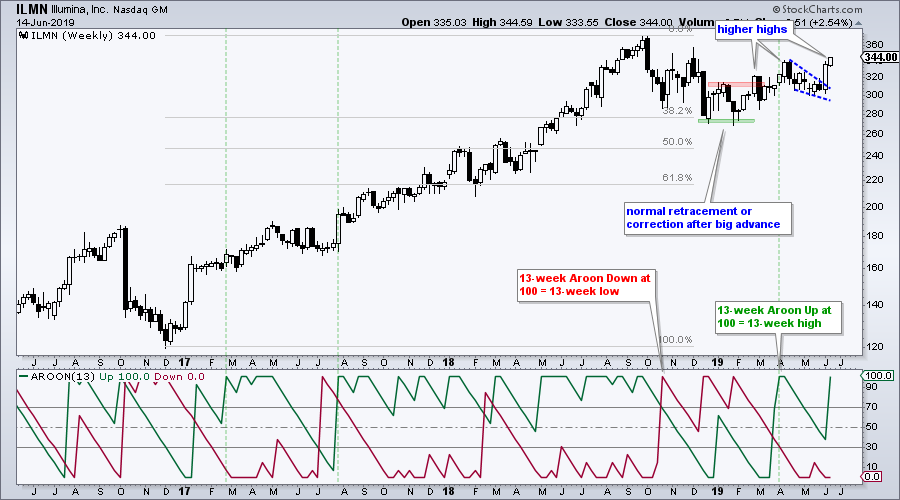
On the price chart, the bigger uptrend resumed with some higher highs, a wedge break and another 13-week high. ILMN tripled from December 2016 to October 2018 and then corrected with a decline that retraced a little more than 38.2%. ILMN firmed in the 270-280 area with bounces in late December and late January (green zone). The correction ended with a breakout and the first higher high in late February (red zone). The stock went on to record higher highs in early April and early June.
Shorter-term, notice the falling wedge from mid April to late May and the breakout with the long white candlestick in early June. This move also produced another 13-week high as Aroon Up (13) hit 100 for the second time this year. Note that 13-week Aroon Up hits 100 when the stock records a 13-week high and Aroon Down hits 100 when the stock records a 13-week low.
Overall, the long-term trend is up and the medium-term downtrend reversed with the February breakout. ILMN has been working its way higher since late February and shows upside leadership because it is above its April high. Given the current uptrend and relative strength, I would expect the stock to hit new highs in the coming weeks and months. A close below 300 would call for a re-evaluation.
On Trend on YouTube (Thursday, June 13th)
- SPY, QQQ and IWM Hold Breakouts
- Biotech ETFs Hit Reversal Zones
- Chinese ETFs Diverge as ASHR Outperforms
- "On Trend" Stocks to Watch
- Click here to Watch
Arthur Hill, CMT
Senior Technical Analyst, StockCharts.com
Author, Define the Trend and Trade the Trend
Want to stay up to date with the latest market insights from Arthur?
– Follow @ArthurHill on Twitter
– Subscribe to Art's Charts
– Watch On Trend on StockCharts TV (Tuesdays / Thursdays at 10:30am ET)


