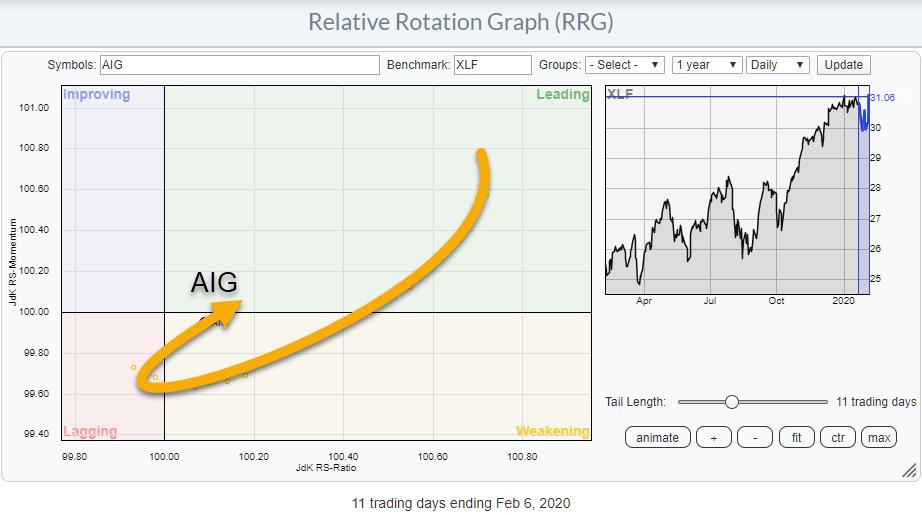
While browsing through some RRGs, my eye fell on a rare rotation in the Financial sector.
AIG, on the daily RRG, was coming from leading through weakening and just hit the lagging quadrant a few days ago. Then, just yesterday, the stock "hooked" back aggressively, taking it from lagging back into weakening and almost all the way into leading again. This sort of rotation indicates a sharp move - and when I looked at the chart, I noticed why.
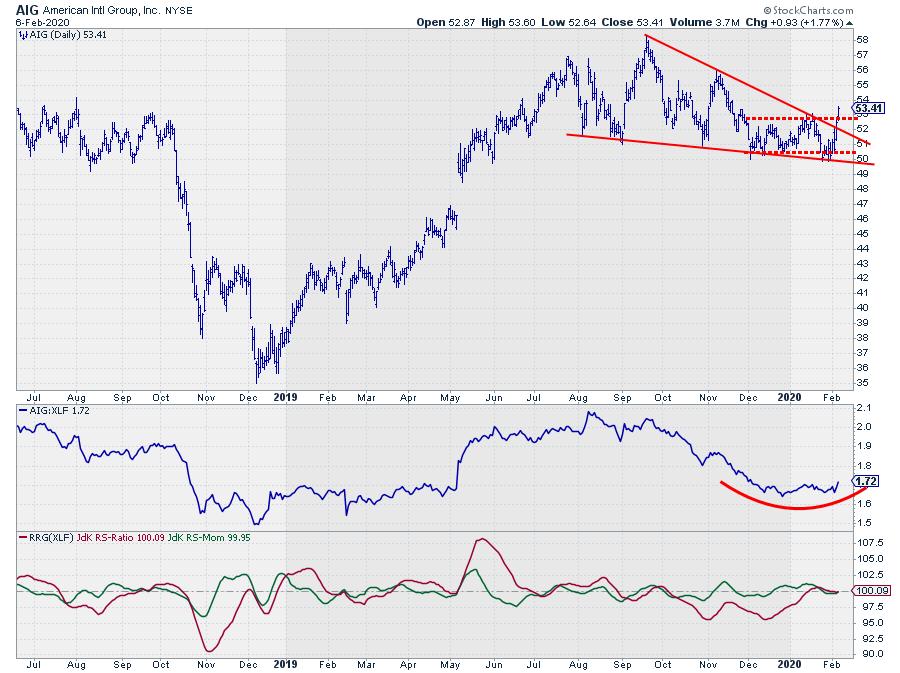
AIG peaked back in September 2019 and then started to drift sideways to down. In that process, a series of lower highs were formed, as well as lower lows. However, the trendline connecting the highs (resistance) is much steeper than the trendline (support) connecting the lows. Such a pattern is known as a wedge, in this case a falling wedge. (You can read more about this pattern in this ChartSchool article.)
Yesterday, Wednesday 2/5, AIG broke out of that wedge formation to the upside, triggering the "signal" that the wedge has been completed and more upside price action could be expected.
Today, Thursday 2/6, the rally continued and also broke above a resistance area offered by a cluster of highs from December and January. And, with a little fantasy, one could even judge it as the break of a double bottom. In any case, resistance levels are getting broken and a bullish price pattern (the falling wedge) has executed.
With former resistance (around $52.50-53.00) now coming back as support and the price target following the break from the wedge near $58, we now have a good risk/reward ratio for AIG. From a relative perspective, a bottom seems to have been tracing out since December. The "hook" on the RRG is signaling renewed strength after the initial push into the leading quadrant.
I think this is a stock to keep an eye on.
-- Julius
My regular blog is the RRG Charts blog.
Julius de Kempenaer
Senior Technical Analyst, StockCharts.com
Creator, Relative Rotation Graphs
Founder, RRG Research
Want to stay up to date with the latest market insights from Julius?
– Follow @RRGResearch on Twitter
– Like RRG Research on Facebook
– Follow RRG Research on LinkedIn
– Subscribe to the RRG Charts blog on StockCharts
Feedback, comments or questions are welcome at Juliusdk@stockcharts.com. I cannot promise to respond to each and every message, but I will certainly read them and, where reasonably possible, use the feedback and comments or answer questions.
To discuss RRG with me on S.C.A.N., tag me using the handle Julius_RRG.
RRG, Relative Rotation Graphs, JdK RS-Ratio, and JdK RS-Momentum are registered trademarks of RRG Research.
Julius de Kempenaer
Senior Technical Analyst, StockCharts.com
Creator, Relative Rotation Graphs
Founder, RRG Research
Host of: Sector Spotlight
Please find my handles for social media channels under the Bio below.
Feedback, comments or questions are welcome at Juliusdk@stockcharts.com. I cannot promise to respond to each and every message, but I will certainly read them and, where reasonably possible, use the feedback and comments or answer questions.
To discuss RRG with me on S.C.A.N., tag me using the handle Julius_RRG.
RRG, Relative Rotation Graphs, JdK RS-Ratio, and JdK RS-Momentum are registered trademarks of RRG Research.


