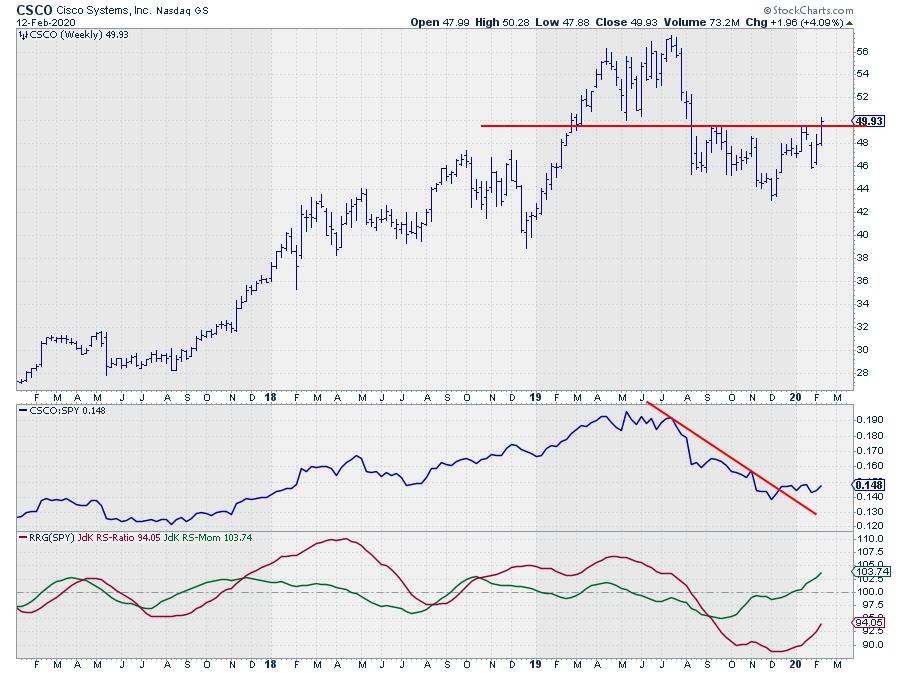
CSCO peaked in the first half of 2019. The first time at $ 56.30 in April and then again in July at $ 57.40. A typical failure to convincingly break above a previous high. From July onward CSCO moved lower to a low around $ 43 at the start of December.
The formation that triggers my interest is the inverted H&S like pattern that traced out after the first steep drop.
This stock also caught the attention on the Relative Rotation Graph for Dow components, where it is positioned inside the improving quadrant and travelling towards leading at a strong RRG-Heading.
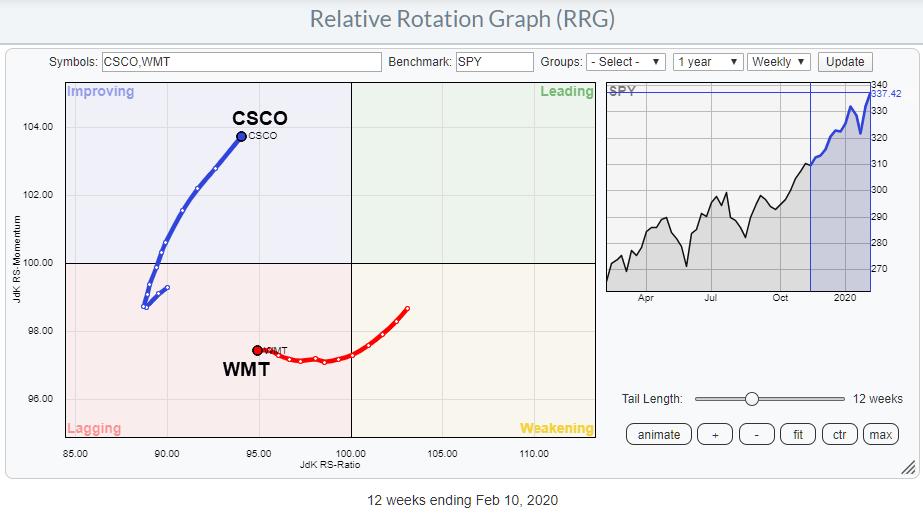
At the same time we find WMT inside the lagging quadrant and travelling further into it.
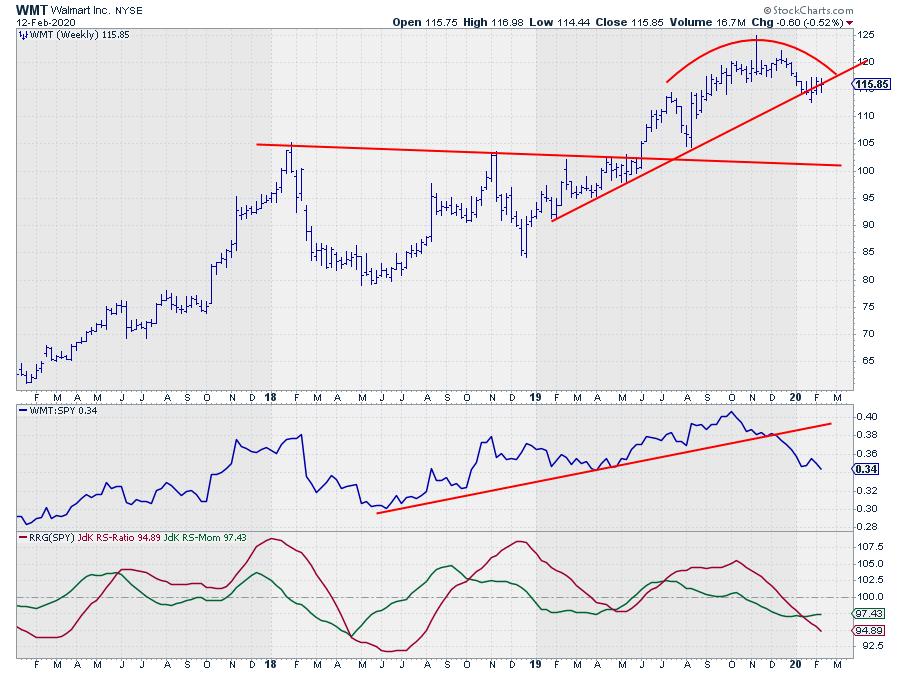
The price chart of WMT also looks quite the opposite of CSCO with a potential top being put into place and price now struggling to hold at or above the rising support line.
The relative strength of WMT (vs SPY) is sending a very clear signal. The upward trend has been broken and the most likely move is further down.
This opposite rotation on the RRG in combination with strong, for CSCO, and weak, for WMT, price charts make a direct comparison between these two stocks interesting.
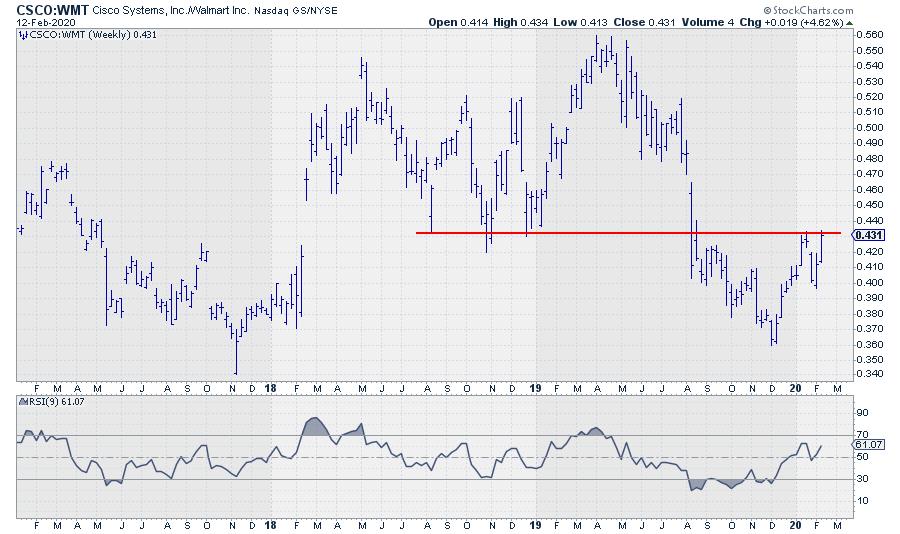
The ratio of CSCO vs WMT shows a rally out of its December low which has taken out two previous highs after which a first higher low has been set. At the moment the ratio is pushing against the early Jan high and a break of that level will very likely ignite more upside.
The positive divergence between the ratio and its RSI is supportive for a further move higher, which makes an outperformance of CSCO over WMT in coming weeks likely.
-- Julius
My regular blog is the RRG Chartsblog. If you would like to receive a notification when a new article is published there, simply "Subscribe" with your email address.
Julius de Kempenaer
Senior Technical Analyst, StockCharts.com
Creator, Relative Rotation Graphs
Founder, RRG Research
Want to stay up to date with the latest market insights from Julius?
– Follow @RRGResearch on Twitter
– Like RRG Research on Facebook
– Follow RRG Research on LinkedIn
– Subscribe to the RRG Charts blog on StockCharts
Feedback, comments or questions are welcome at Juliusdk@stockcharts.com. I cannot promise to respond to each and every message, but I will certainly read them and, where reasonably possible, use the feedback and comments or answer questions.
To discuss RRG with me on S.C.A.N., tag me using the handle Julius_RRG.
RRG, Relative Rotation Graphs, JdK RS-Ratio, and JdK RS-Momentum are registered trademarks of RRG Research.
Julius de Kempenaer
Senior Technical Analyst, StockCharts.com
Creator, Relative Rotation Graphs
Founder, RRG Research
Host of: Sector Spotlight
Please find my handles for social media channels under the Bio below.
Feedback, comments or questions are welcome at Juliusdk@stockcharts.com. I cannot promise to respond to each and every message, but I will certainly read them and, where reasonably possible, use the feedback and comments or answer questions.
To discuss RRG with me on S.C.A.N., tag me using the handle Julius_RRG.
RRG, Relative Rotation Graphs, JdK RS-Ratio, and JdK RS-Momentum are registered trademarks of RRG Research.


