One of the scans that I run on a daily basis is my scan for "Turtle Soup" Buy signals. Actually, I have two versions of that scan - one that runs at last day's close and one that runs on last intraday update.
For the scan based on yesterday's close, I have set the alert to an email. So, every day after the close, I get an email with the ticker symbols that were triggered based on that scan. That is, if there were any symbols fulfilling all the criteria, of course.
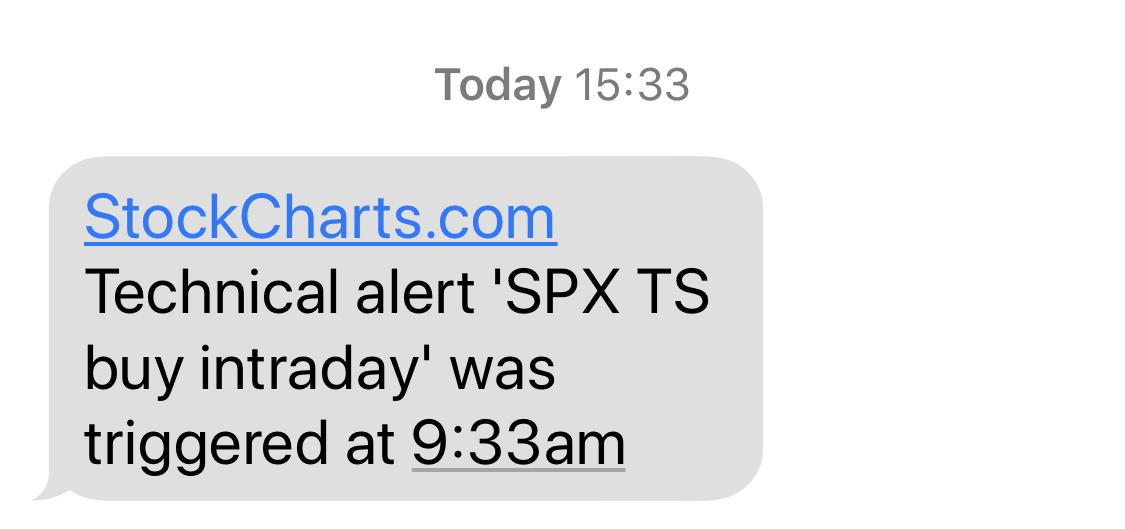
The second scan runs intraday and I get a text-message to my phone when one or more stocks triggered that alert to fire.When the market is correcting, the number of stocks on that list starts to grow, which is not surprising as the scan looks for 20-day lows (and a few more criteria).
Yesterday's scan after the close had 80 symbols on the list. This morning, I received the text message alert that, again, one or more members of the S&P 500 index (hence the name of the scan holds "SPX") triggered a potential Turtle Soup Buy setup.
So I go to my PC and run that scan to find out that 29 stocks triggered the alert. The next thing I then do is to copy the list to a chart-list. I use "replace an existing chartlist with these results", which I can then run an RRG on (daily time frame).
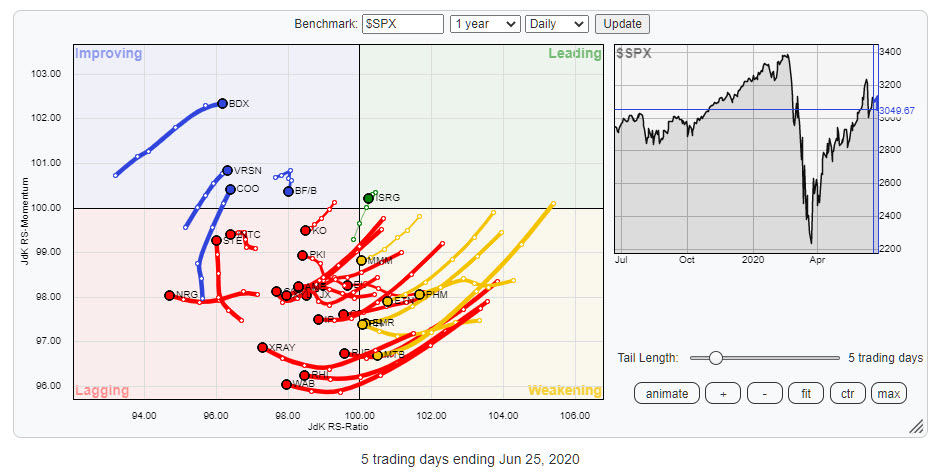
In general, this universe is not looking too well, which is understandable as we are fishing for stocks that are coming down and testing support in the area of the 20-day low. Of these 29 stocks, only four are in improving and one is inside leading.

After reviewing these five stocks on a regular chart, I picked VRSN as a potential buying candidate. It is inside the improving quadrant and moving at a strong RRG-Heading.
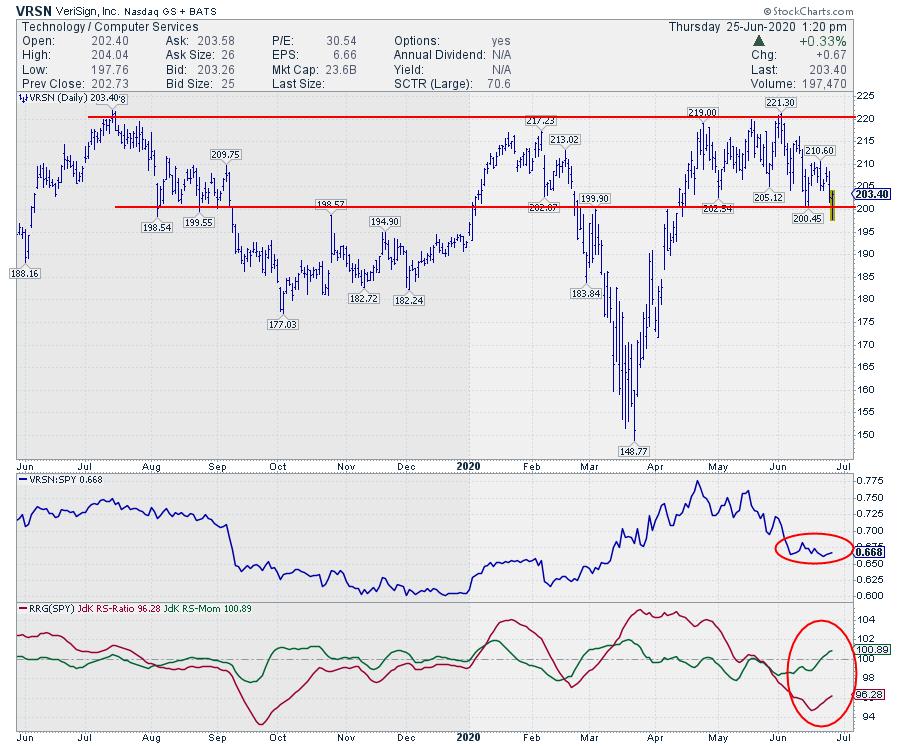
On the price chart, the $200 level has been tested a few times before as support as well as resistance. Today's dip below $200, $200.45 was the prior 20-day low, which is important for the TS-setup, and the rapid recovery looks to be a new test of that support level and it seems to be holding.
Following the rules for the TS-buy-setup, the setup was triggered when VRSN dropped below $200.45 this morning. The buy signal was triggered when VRSN came back above $200.45 (+ a dollar or so). The initial stop for this position is just below $197.76, the low of today so far.
#StaySafe, --Julius
My regular blog is the RRG Charts blog. If you would like to receive a notification when a new article is published there, simply "Subscribe" with your email address.
Julius de Kempenaer
Senior Technical Analyst, StockCharts.com
Creator, Relative Rotation Graphs
Founder, RRG Research
Host of: Sector Spotlight
Please find my handles for social media channels under the Bio below.
Feedback, comments or questions are welcome at Juliusdk@stockcharts.com. I cannot promise to respond to each and every message, but I will certainly read them and, where reasonably possible, use the feedback and comments or answer questions.
To discuss RRG with me on S.C.A.N., tag me using the handle Julius_RRG.
RRG, Relative Rotation Graphs, JdK RS-Ratio, and JdK RS-Momentum are registered trademarks of RRG Research.


