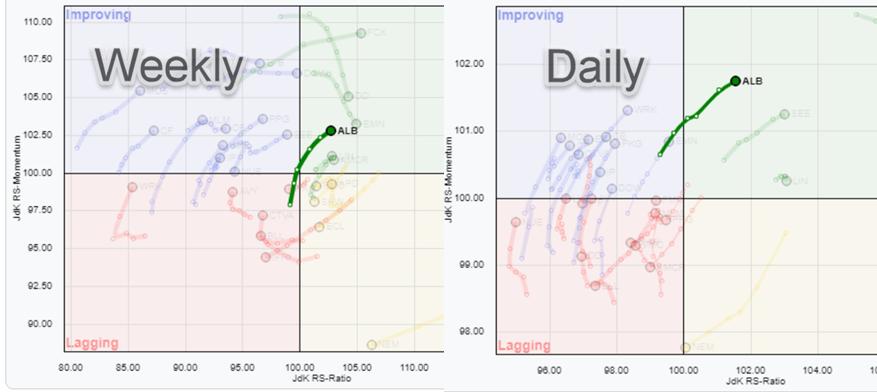
With the Materials sector (XLB) moving into the leading quadrant on the weekly RRG, it makes sense to look for some individual stocks that may offer upside potential. Using Relative Rotation Graphs, we can do just that by loading all members of the Materials sector and using XLB as the benchmark from the dropdown box.
A stock that really attracts attention on both the weekly and the daily RRG is ALB, Albemarle. The two images above show the trajectory for the weekly tail (on the left) and the daily version (on the right). Both tails are rotating nicely into the leading quadrant at a positive RRG-Heading (0-90 degrees), which suggests that there is more (relative) upside potential for this stock going forward.
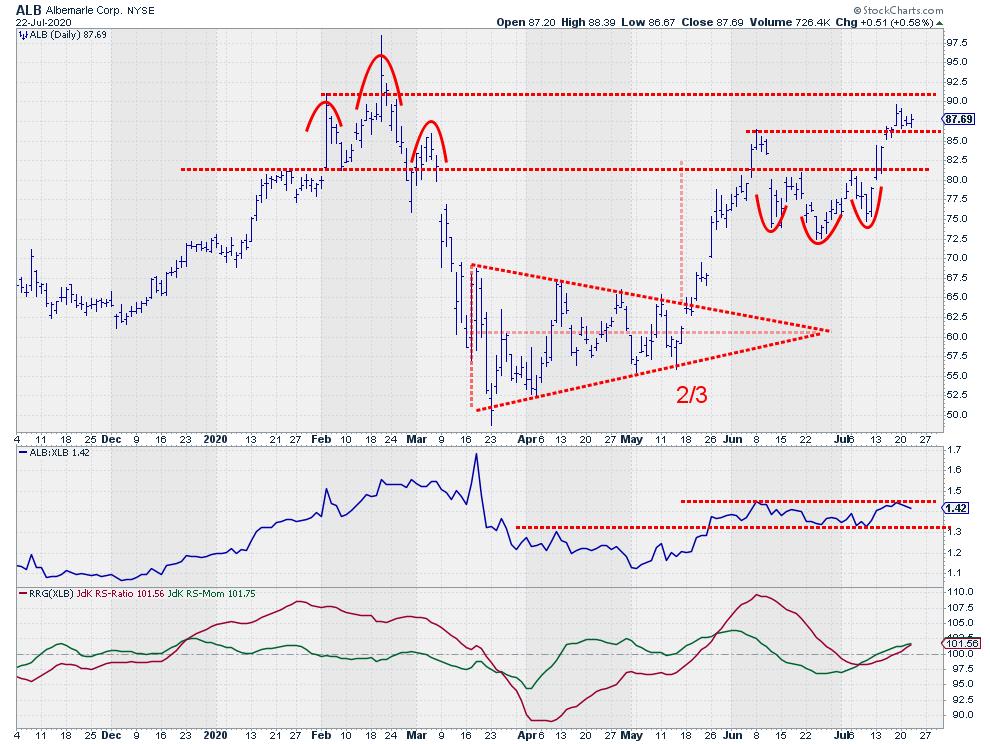
When I opened the price chart, I noticed some nice technical patterns that have worked for ALB so far this year.
First, in February of this year, there was the small H&S reversal pattern that completed after the uptrend that started in December 2019.
Then, after the decline following the completion of that H&S formation, an almost perfect symmetrical triangle formed. There were four touch points on the declining resistance, as well as four touch points on the rising support and an upward break around 2/3 of the base of the formation (they don't get much better than this). This was followed by a nice rally that meets, and slightly exceeds, the price target after a few weeks.
After the peak at $86.50, which was just over the expected horizontal resistance right above $81, ALB dropped back below this level, then had trouble getting back above it for about a month. During this time, an inverted H&S continuation pattern formed, which was completed with the break back above resistance/neckline around $81.
Currently, the stock is working its way higher following that break. Meanwhile, it has taken out the high at $86.50, which adds to the positive outlook. The next hurdle is the horizontal resistance around $91*
*Or $98.40 depending on where you draw your resistance. I prefer to use the level where the "meat" of the price action has taken place - IMHO, that is more in the area around $90-$91 than at the spike at $98.40. This observation gets even stronger when you add more history to the chart.
With both the weekly and the daily tails for ALB rotating into the leading quadrant, I am watching for a break above $91 and a further move upward.
#StaySafe, --Julius
My regular blog is the RRG Charts blog. If you would like to receive a notification when a new article is published there, simply "Subscribe" with your email address.
Julius de Kempenaer
Senior Technical Analyst, StockCharts.com
Creator, Relative Rotation Graphs
Founder, RRG Research
Host of: Sector Spotlight
Please find my handles for social media channels under the Bio below.
Feedback, comments or questions are welcome at Juliusdk@stockcharts.com. I cannot promise to respond to each and every message, but I will certainly read them and, where reasonably possible, use the feedback and comments or answer questions.
To discuss RRG with me on S.C.A.N., tag me using the handle Julius_RRG.
RRG, Relative Rotation Graphs, JdK RS-Ratio, and JdK RS-Momentum are registered trademarks of RRG Research.


