
Ok, the header image may not be entirely accurate to the message of this article, as it deals with the Real Estate sector which is all about listed REITs, but I could not resist using it ;)
When I looked at the Relative Rotation Graphs for sectors this morning, I noticed the tail for XLRE, the Real Estate sector, was rotating in a positive direction on both the weekly and the daily RRG.
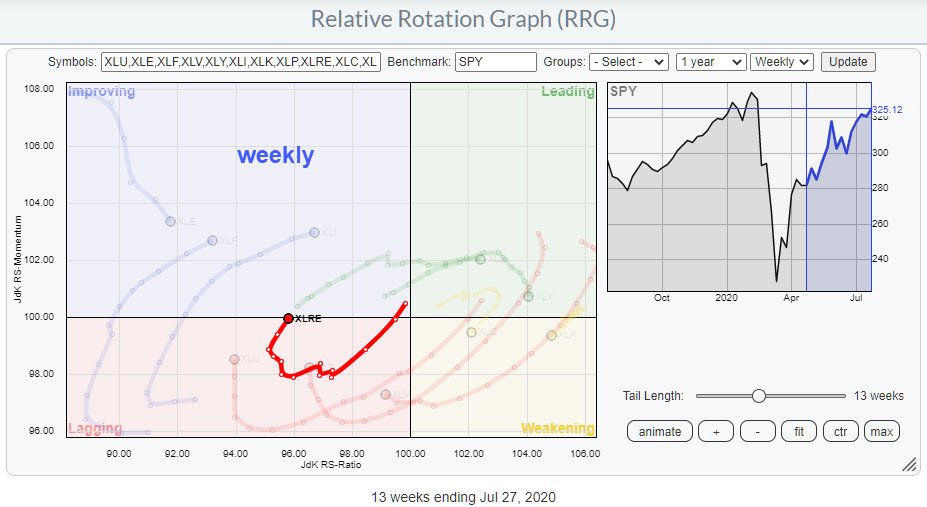
On this chart, XLRE is still inside the lagging quadrant, but very close to crossing over into lagging and traveling at a positive RRG-Heading.
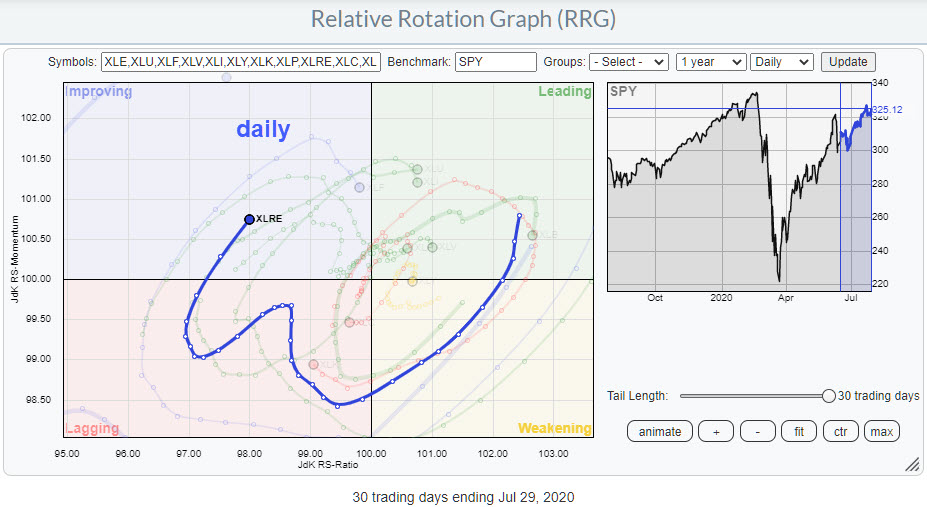
On the daily RRG, XLRE is already well inside the leading quadrant and also traveling at a positive RRG-Heading. This image with the long tail shows the improvement that the sector went through over the last, say, two weeks after rotating out of leading into weakening and then into lagging.
Such an alignment of tails, even if it's in the very early stage like this one, deserves a further inspection of the price chart.
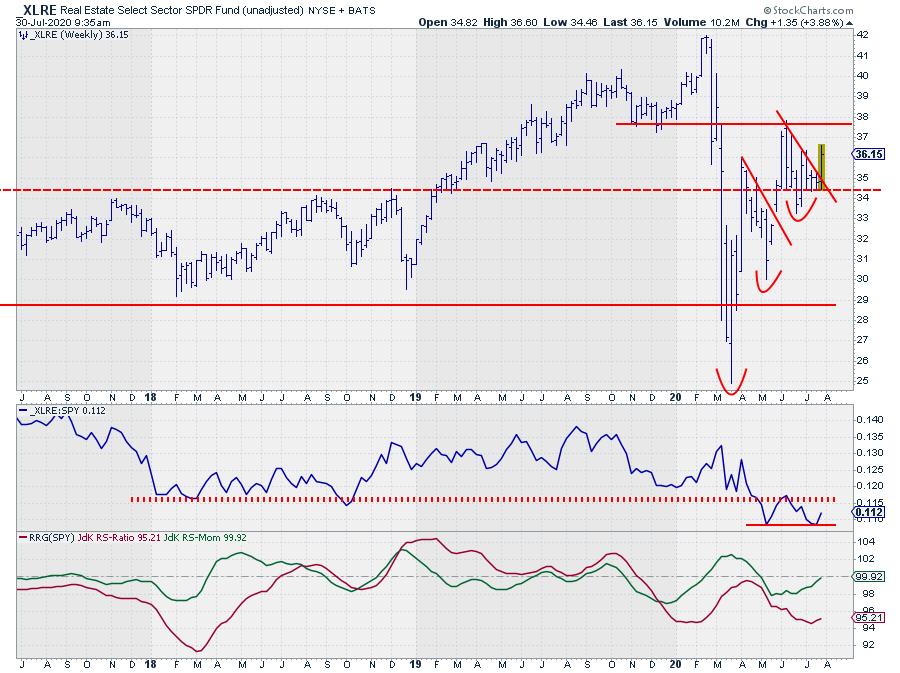
On the weekly chart above, it can be seen that XLRE is breaking away from a consolidation this week, which opens up the way for a move to the next resistance level just below $38. When XLRE can take out that level, the next target will be around the former peak at $42.
The RS-Line just bottomed at the same levels as its previous low, which creates the possibility for a double bottom. This formation will execute when that previous high, which is also long-term resistance after the recent break, can be taken out. This week, and maybe the next two weeks, will show us if that is happening.
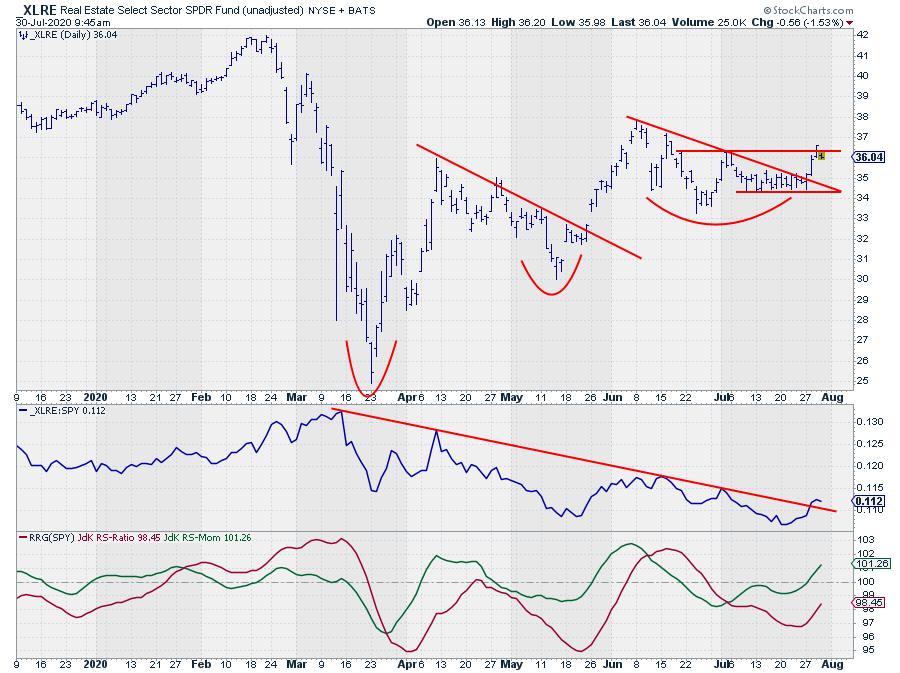
The daily chart shows the recent price action in a little more detail and also shows that $36.30 is the short term hurdle that needs to be taken out for further upside. The RS-Line nicely broke the falling resistance but now needs to hold there and move higher.
All in all a nice early message from the RRG charts with good potential if these price structures hold up in coming days!!
#StaySafe, --Julius
My regular blog is the RRG Charts blog. If you would like to receive a notification when a new article is published there, simply "Subscribe" with your email address.
Julius de Kempenaer
Senior Technical Analyst, StockCharts.com
Creator, Relative Rotation Graphs
Founder, RRG Research
Host of: Sector Spotlight
Please find my handles for social media channels under the Bio below.
Feedback, comments or questions are welcome at Juliusdk@stockcharts.com. I cannot promise to respond to each and every message, but I will certainly read them and, where reasonably possible, use the feedback and comments or answer questions.
To discuss RRG with me on S.C.A.N., tag me using the handle Julius_RRG.
RRG, Relative Rotation Graphs, JdK RS-Ratio, and JdK RS-Momentum are registered trademarks of RRG Research.


