There is no doubt that the technology sector is still the strongest segment in the US stock market, but, in the near term, it is losing some of its relative momentum, as you can see on the daily Relative Rotation Graph for US sectors. One of the stocks in that sector with a really weak chart is IBM.
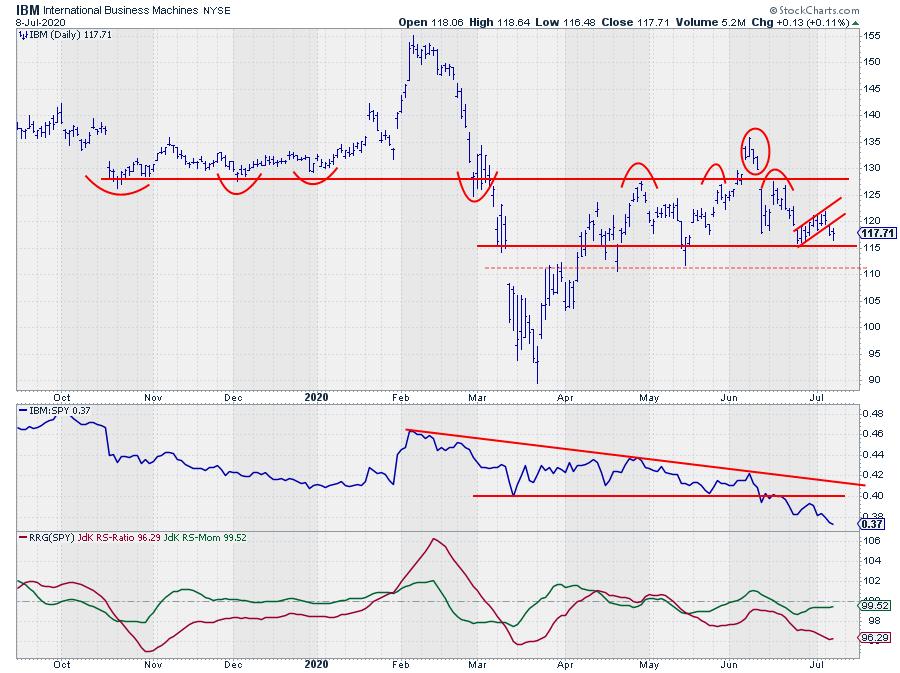
The daily chart above shows IBM since October last year. During Q4-2019, support showed up around $127.50, which was tested three times and was followed by a rally from the start of 2020 until early February. That high was set well before Corona hit the markets.
In the decline, support around $127.50 showed up once again and was able to stop the move for a few days, but eventually had to give way to a further move lower that ended, for now, at the low in March around $93.
When the market, especially the technology sector, started to rally, so did IBM. Initially, it was in line with the market and the sector. But that changed in the first week of June when XLK continued its rally while SPY started to consolidate. At that time, IBM dropped sharply vs. both the market and the sector and, even with the latest up-tick in the market, IBM has not been able to keep up. See this PerfChart.
In the move out of that March low, the old support area around $127.50 started to work as resistance. From 5-10 June, it looked as if that hurdle was cleared, but the gap down on 11 June caused a clear island formation on the daily chart and took IBM back below $127.50. That gap never got closed, making the island stand out as a clear peak signaling weakness.
At the moment, IBM is hovering just above support at $115, but the sequence of lower highs and lower lows is clearly visible. Below $115, the next support level (less important than $115 IMHO) is waiting.
Whereas price is still above support, relative strength clearly is not. The break below horizontal support in June pushed the RRG-Lines further down and caused the RS-Momentum line to drop back below a 100, this caused a rotation back to the lagging quadrant from improving, which usually signals more weakness.
Watch out for a break below $115, as that will very likely be the catalyst for another acceleration lower.
#StaySafe, --Julius
My regular blog is the RRG Charts blog. If you would like to receive a notification when a new article is published there, simply "Subscribe" with your email address.
Julius de Kempenaer
Senior Technical Analyst, StockCharts.com
Creator, Relative Rotation Graphs
Founder, RRG Research
Host of: Sector Spotlight
Please find my handles for social media channels under the Bio below.
Feedback, comments or questions are welcome at Juliusdk@stockcharts.com. I cannot promise to respond to each and every message, but I will certainly read them and, where reasonably possible, use the feedback and comments or answer questions.
To discuss RRG with me on S.C.A.N., tag me using the handle Julius_RRG.
RRG, Relative Rotation Graphs, JdK RS-Ratio, and JdK RS-Momentum are registered trademarks of RRG Research.


