To get some inspiration for a nice subject or stock to show in this article, I went to my dashboard, on which I have one widget that shows the most actively traded stocks in the Dow Jones Industrials index.
A nice little gimmick is that you can run an RRG for that universe by clicking on the RRG link below the widget. The graph will populate with the stocks listed in the widget. In this case, those were the 10 most actively traded stocks inside $INDU today.
As this list changes every day (and even intraday), I usually switch the RRG to the daily timeframe. And when I did that this morning, there was one, and only one, stock that stood out from all others in a positive way. Apple!!!
 The tail on AAPL reversed its rotation back upward about five days ago, following a rotation through weakening and two days inside lagging, and is now pushing hard to move further into the leading quadrant.
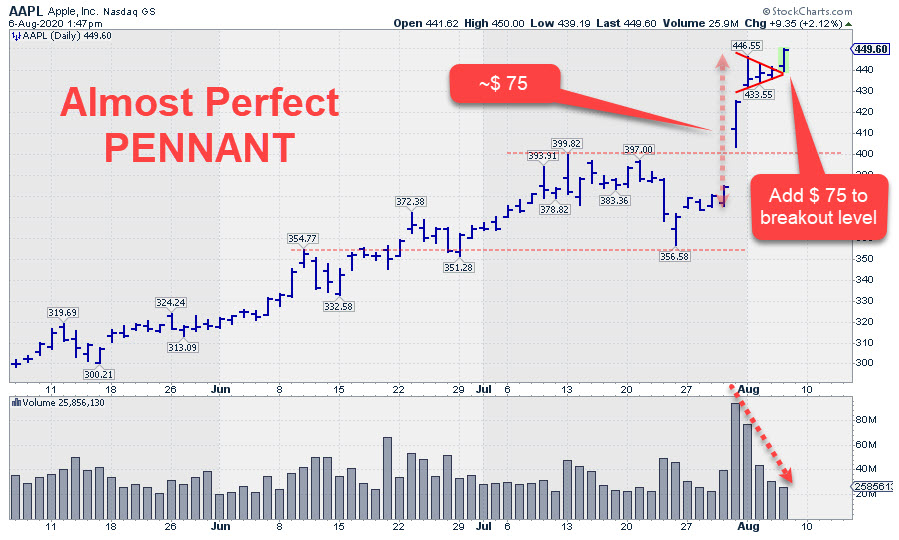
When I opened up the price chart for AAPL, I noted an almost perfect pennant from which AAPL is breaking away today.
The stock is consolidating after an almost straight move higher. The consolidation is small and condensed and should not last longer than 3-4 weeks, and volume should diminish during the forming of the pennant.
So far, the current chart of AAPL ticks all those boxes. The only thing that would help, but is not crucial for success, is an increase in volume during and after the break away from the consolidation.
The extra benefit for patterns like flags and pennants is that they allow for easy calculation of potential price targets. You take the height of the "flag pole" and add that distance to the breakout level. When I do that, it gives a target that is well above $ 500...
Whether it is realistic and will be reached remains to be seen, but so far AAPL ticks all the boxes that were described for the first time in 1948 and have stood the test of time ever since.
I'd say that is interesting enough for us to watch at the moment.
#StaySafe, --Julius
My regular blog is the RRG Chartsblog. If you would like to receive a notification when a new article is published there, simply "Subscribe" with your email address.
Julius de Kempenaer
Senior Technical Analyst, StockCharts.com
Creator, Relative Rotation Graphs
Founder, RRG Research
Host of: Sector Spotlight
Please find my handles for social media channels under the Bio below.
Feedback, comments or questions are welcome at Juliusdk@stockcharts.com. I cannot promise to respond to each and every message, but I will certainly read them and, where reasonably possible, use the feedback and comments or answer questions.
To discuss RRG with me on S.C.A.N., tag me using the handle Julius_RRG.
RRG, Relative Rotation Graphs, JdK RS-Ratio, and JdK RS-Momentum are registered trademarks of RRG Research.


