Last Tuesday in Sector Spotlight, I covered the Industrials sector. While looking into the constituents of the sector and the group breakdown, it was pretty clear that the group "airlines" is not doing very well.
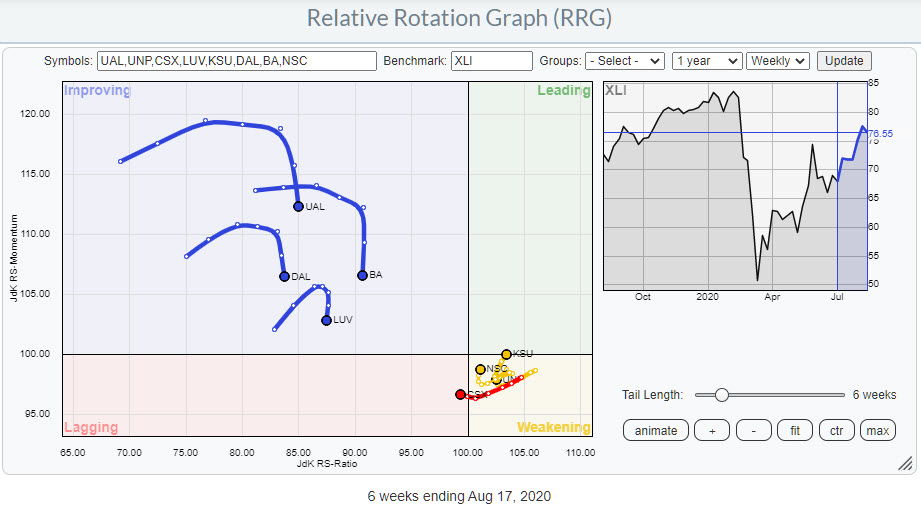
UAL, DAL and LUV are all inside the improving quadrant, but they also all have rolled over and are heading back down to the lagging quadrant again. Add BA to the mix and the image is pretty clearly negative for everything that flies. Or "used to fly." ;)
But what is interesting to see is that the railroads are tracing out an almost opposite trajectory. KSU, UNP and NSC are all inside weakening and curling back up. The only outlier in this group is CSX, which just hit the lagging quadrant. The KSU chart looks interesting, IMHO.
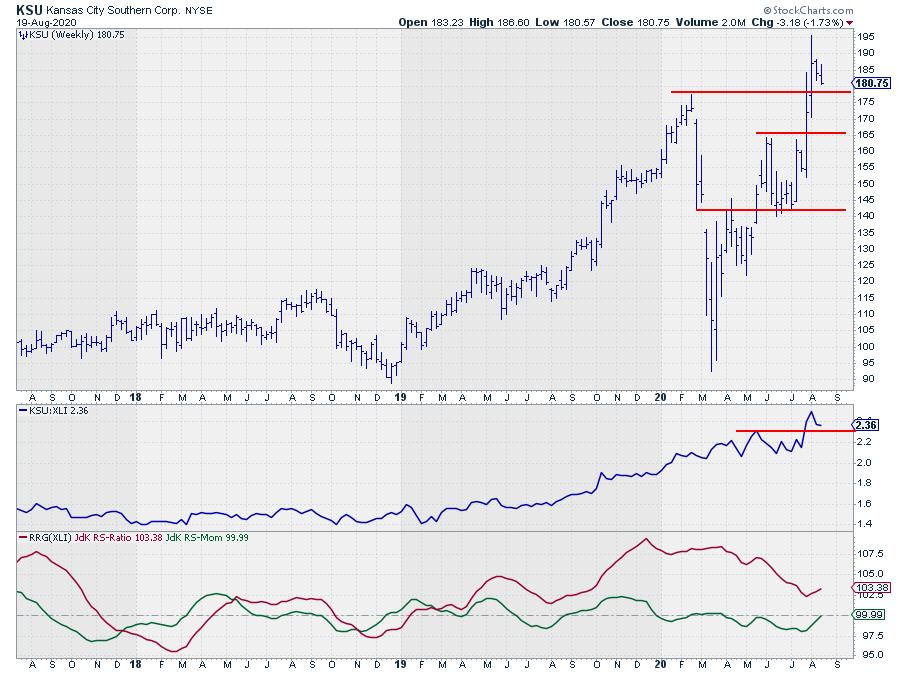
This railroad broke above its previous high three weeks ago and is holding up well so far. As long as KSU manages to hold above its previous high, now expected to act as support, between $175-$177.50, this could be a good (re-)entry opportunity.
The relative strength for KSU vs. XLI already started moving higher at the start of 2019. Since that time, there have been a few rotations that completed at the right hand side of the RRG (leading, weakening, leading), underscoring the strength of the stock vs. XLI.
This is now happening again and it signals a new (relative) up-leg for KSU vs. XLI.
With airplanes grounded, trains are now riding and KSU looks to be headed in the right direction.
#StaySafe, --Julius
My regular blog is the RRG Charts blog. If you would like to receive a notification when a new article is published there, simply "Subscribe" with your email address.
Julius de Kempenaer
Senior Technical Analyst, StockCharts.com
Creator, Relative Rotation Graphs
Founder, RRG Research
Host of: Sector Spotlight
Please find my handles for social media channels under the Bio below.
Feedback, comments or questions are welcome at Juliusdk@stockcharts.com. I cannot promise to respond to each and every message, but I will certainly read them and, where reasonably possible, use the feedback and comments or answer questions.
To discuss RRG with me on S.C.A.N., tag me using the handle Julius_RRG.
RRG, Relative Rotation Graphs, JdK RS-Ratio, and JdK RS-Momentum are registered trademarks of RRG Research.


