The S&P 500 and the Nasdaq 100 are probably the most discussed charts/indexes. The Dow Jones Industrials is probably the most well known index. From an RRG point of view, the breakdown of the S&P 500 into its sectors is probably the most-watched RRG.
But, in Dow terms, the Dow Jones Industrials index (30 stocks) is actually a segment of the Dow Jones Composite Index (65). The other two segments are the Dow Jones Transport Index, 20 stocks, and the Dow Jones Utility Index, 15 stocks. Together these three Dow indexes make up the Dow Jones Composite Index, 65 stocks.
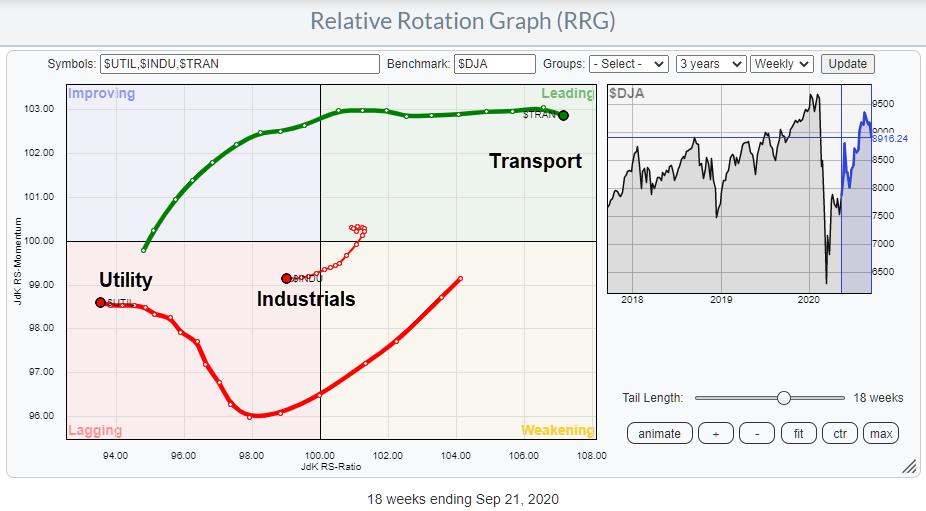
The Relative Rotation Graph above shows these three Dow Indexes against the Composite Index, which is the benchmark/center on that RRG. On this weekly RRG, the strength of Transport stands out vs the weakness for Industrials and Utility, which are both inside the lagging quadrant and moving further left.
In particular, the Transport Index has been moving higher on the RS-Ratio scale at a stable momentum already for a few months, essentially since $TRAN entered the leading quadrant mid-July. Utility started moving higher on the RS-Momentum scale earlier already, but has moved flatly to slightly higher in the last few weeks. The Industrials have steadily lost both Relative Strength as well as Relative Momentum.
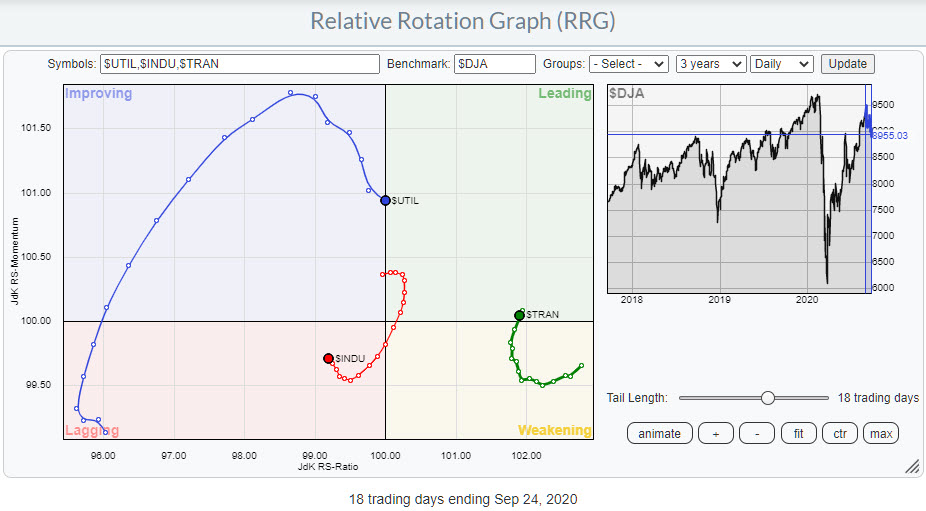
The daily rotation confirms the strength for the Transport Index, while the tail on $UTIL confirms the initial improvement that caused the weekly tail to move higher as it was inside the lagging quadrant, but has now dropped back to a flat (negative) momentum. If daily momentum for $UTIL picks up rapidly, we may see the daily tail head into the leading quadrant and turn back into a stronger RRG-Heading, which might be the push in the back that is needed for the weekly tail to crawl back up towards improving.
The daily and weekly tails for Industrials are on a similar path, with the daily showing a slight improvement recently, but both are still inside lagging and not showing any material improvement.
All in all, the Transport index remains the strongest inside the DJ Composite index for the time being.
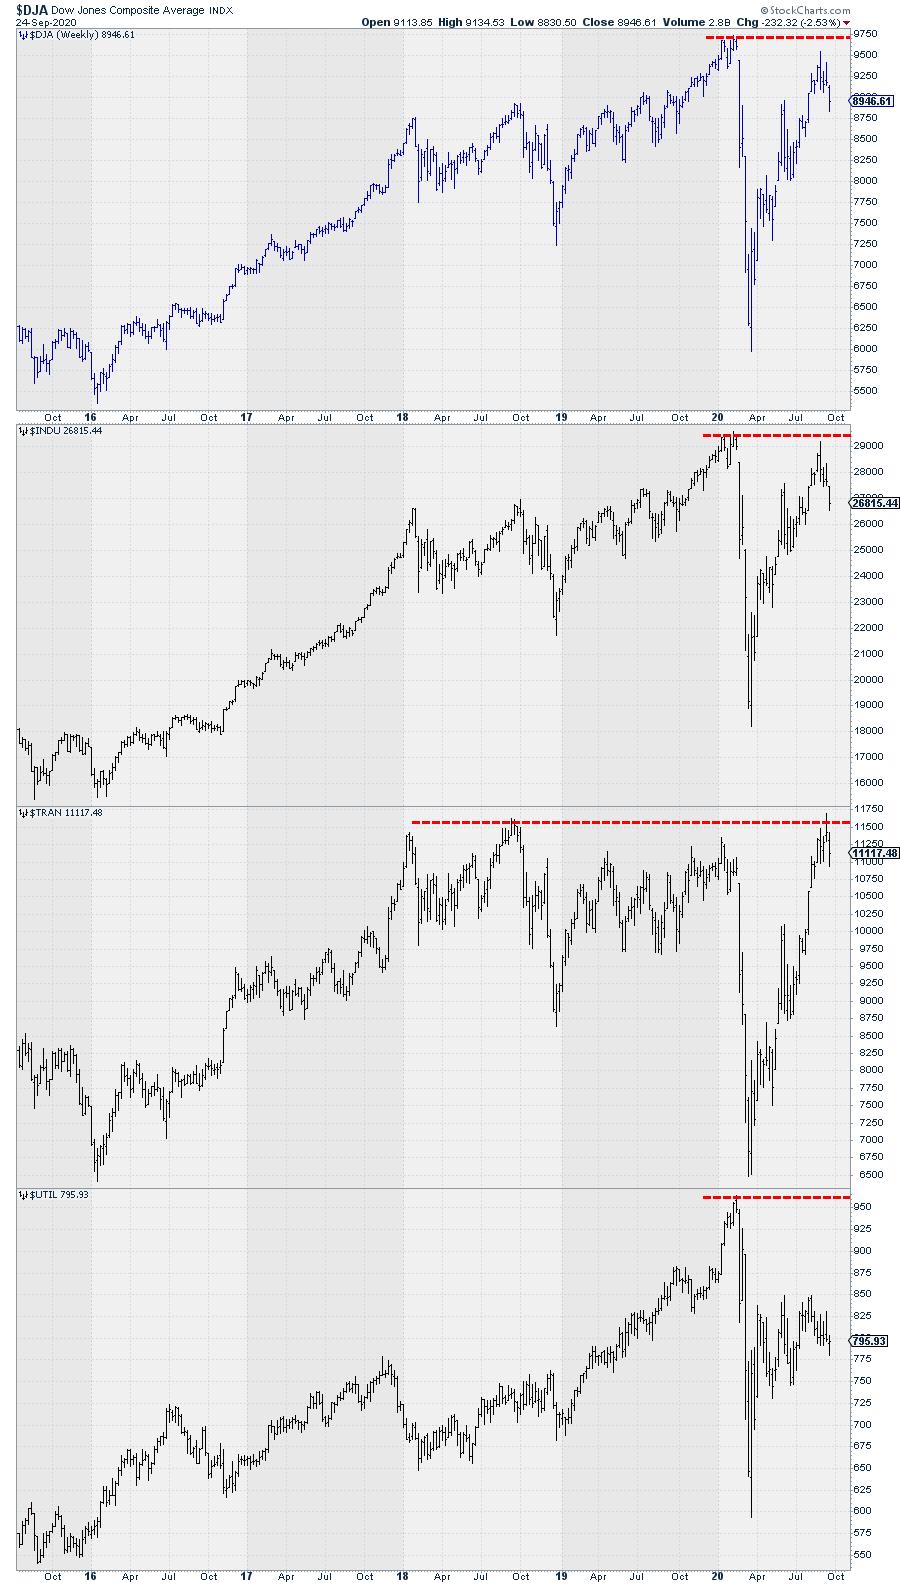
The charts above show the bar charts for all four indexes. Utility is nowhere near its all-time highs, while Industrials and Transport have at least tried to push but both failed. The latter observation is a bit worrisome, as while S&P and Nasdaq pushed to new highs, this set remained below their previous peaks.
I am going to watch this relationship closely in coming weeks to get a warning or a signal for more defense, especially when $UTIL crosses $TRAN on the RS-Ratio scale!
#StaySafe, --Julius
My regular blog is the RRG Chartsblog. If you would like to receive a notification when a new article is published there, simply "Subscribe" with your email address.
Julius de Kempenaer
Senior Technical Analyst, StockCharts.com
Creator, Relative Rotation Graphs
Founder, RRG Research
Host of: Sector Spotlight
Please find my handles for social media channels under the Bio below.
Feedback, comments or questions are welcome at Juliusdk@stockcharts.com. I cannot promise to respond to each and every message, but I will certainly read them and, where reasonably possible, use the feedback and comments or answer questions.
To discuss RRG with me on S.C.A.N., tag me using the handle Julius_RRG.
RRG, Relative Rotation Graphs, JdK RS-Ratio, and JdK RS-Momentum are registered trademarks of RRG Research.


