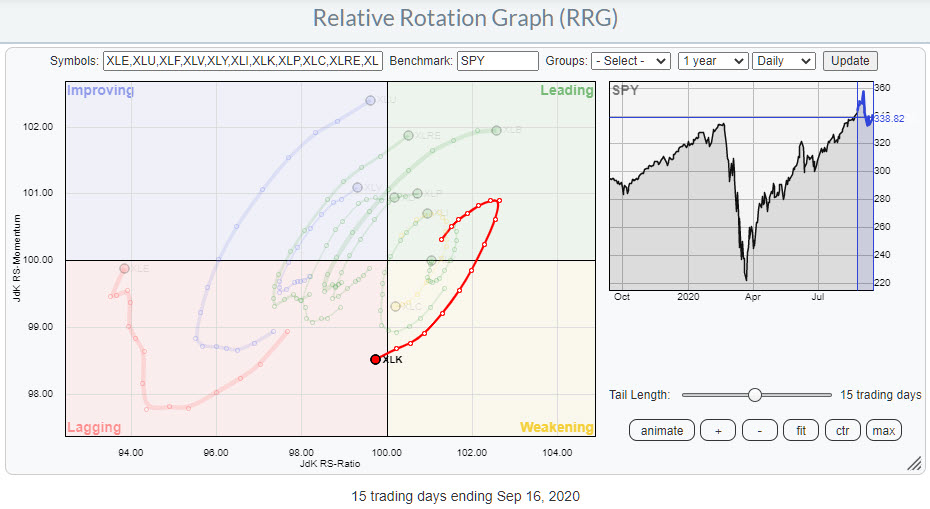
 At yesterday's close XLK, the technology sector, rotated into the lagging quadrant. This happened a few times since the market started to rally out of the March low. On the daily chart to be exact.
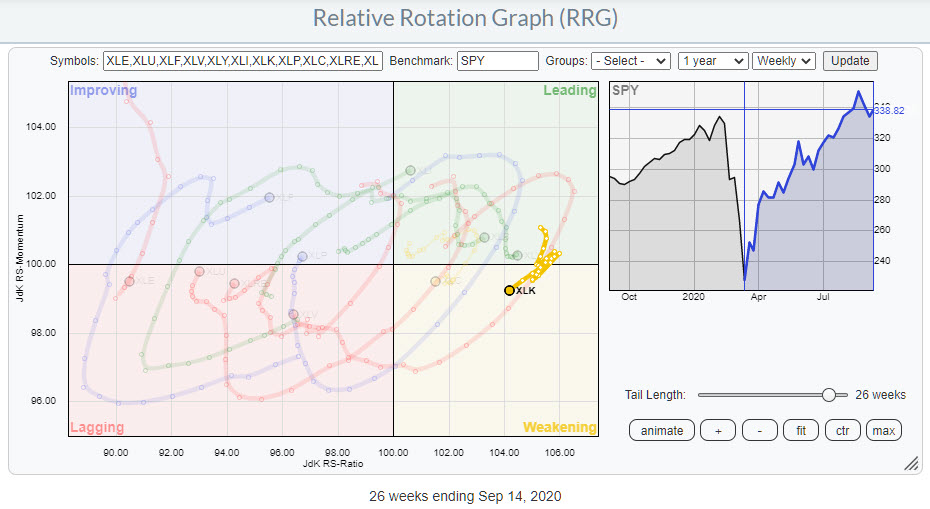
On the weekly RRG, XLK remained far to the right inside the leading or the weakening quadrant during these rotations through lagging, improving, leading on the daily RRG.
Whether this will be another short-term rotation on the daily RRG while the weekly tail remains at the right hand side remains to be seen as there are a few significant differences between the prior daily rotations into lagghing and the current one?
First of all, the recent decline was clearly more vicious than we have seen before since March. And although the rhythm of higher highs and lows is still intact the magnitude of the decline is the biggest we have seen in this up-move.
On the price chart I am watching the horizontal level around $ 111 for support. XLK responded to that area a few times before so a drop below will certainly mean something, in this case negative.
Another thing that caught my eye is in the relationship between the two RRG-Lines, JdK RS-Ratio and JdK RS-Momentum. In all prior occasions the peaks in the RS-Momentum line preceded the peaks in the RS-Ratio line, which is expected behavior for a momentum based metric.
But in the period since XLK came back into the leading quadrant in August, RS-Momentum has peaked twice with the second peak slightly lower than the first one. In the same period RS-Ratio has also peaked twice but the second peak was much higher that the previous one.
I have not done a lot of work yet in researching divergences between RS-Ratio and RS-Momentum but this one is interesting enough to mention and start tracking from here onwards.

#StaySafe, --Julius
My regular blog is the RRG Chartsblog. If you would like to receive a notification when a new article is published there, simply "Subscribe" with your email address.
Julius de Kempenaer
Senior Technical Analyst, StockCharts.com
Creator, Relative Rotation Graphs
Founder, RRG Research
Host of: Sector Spotlight
Please find my handles for social media channels under the Bio below.
Feedback, comments or questions are welcome at Juliusdk@stockcharts.com. I cannot promise to respond to each and every message, but I will certainly read them and, where reasonably possible, use the feedback and comments or answer questions.
To discuss RRG with me on S.C.A.N., tag me using the handle Julius_RRG.
RRG, Relative Rotation Graphs, JdK RS-Ratio, and JdK RS-Momentum are registered trademarks of RRG Research.


