 With returns in the Energy sector flying off the charts, I want to track developments in individual stocks within the sector closely. This is particularly true because the rotation of the sector on the weekly Relative Rotation Graph is still not very strong.
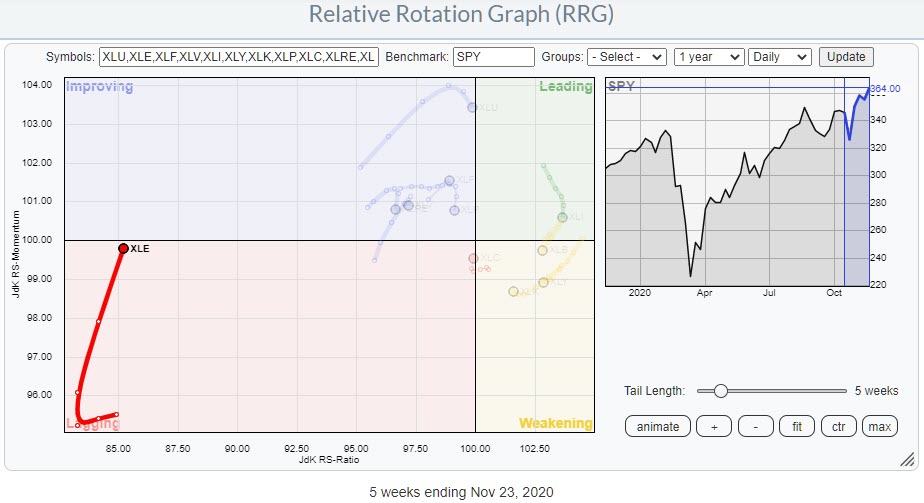
The weekly tail on XLE is shown on the small RRG on the right. The rapid improvement of relative momentum is impressive, but the position on the RRG is not.
The sector is still positioned inside the lagging quadrant, although it will very likely cross into improving soon, but very far to the left, at very low JdK RS-Ratio values detached from the other sectors. Such a position and rotation usually does not make it all the way to the leading quadrant and will very likely roll over when momentum starts to fade.
I already highlighted BKR in a previous article. When I opened the RRG for individual energy stocks against XLE this morning, I noticed the tail on Haliburton (HAL) showing a strong rotation against XLE.
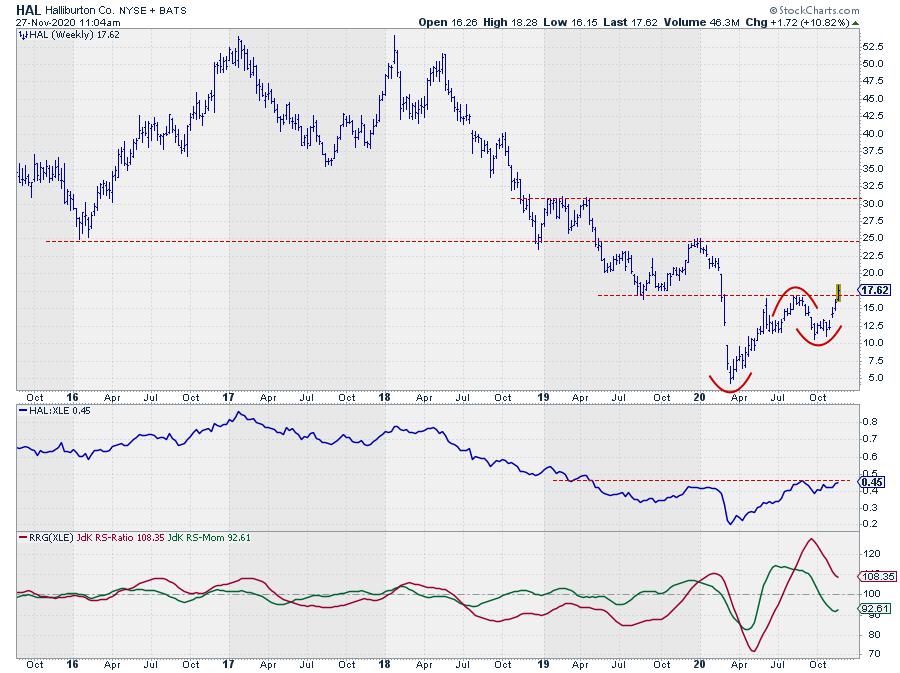
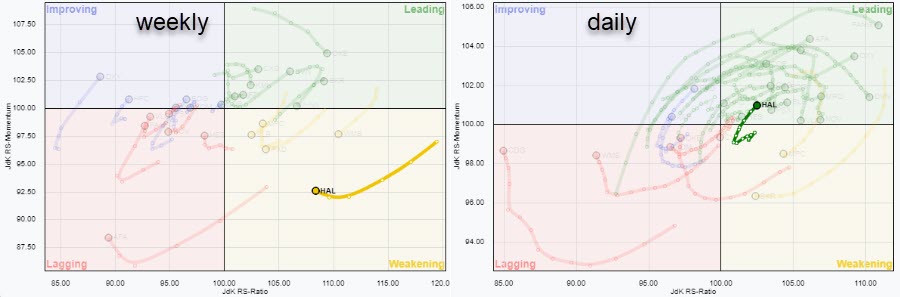
On the weekly RRG (left on top chart), the tail for HAL is inside the weakening quadrant and slowly bending upward. This curve follows the RRG-Lines in the chart above, with RS-Momentum below 100 and RS-Ratio still above it. The slight up-curling direction on the green RS-Momentum line is better visible on the RRG, where the tail is clearly improving.
The daily RRG (right on top chart) shows the tail already pushing into the leading quadrant again, leading the way for further improvement on the weekly RRG.
This week's break above an important resistance level, off the previous peak, confirms the strength for HAL inside the Energy sector and frees the way to $25, where the next hurdle is waiting.
#StaySafe, --Julius
My regular blog is the RRG Charts blog. If you would like to receive a notification when a new article is published there, simply "Subscribe" with your email address.
Julius de Kempenaer
Senior Technical Analyst, StockCharts.com
Creator, Relative Rotation Graphs
Founder, RRG Research
Host of: Sector Spotlight
Please find my handles for social media channels under the Bio below.
Feedback, comments or questions are welcome at Juliusdk@stockcharts.com. I cannot promise to respond to each and every message, but I will certainly read them and, where reasonably possible, use the feedback and comments or answer questions.
To discuss RRG with me on S.C.A.N., tag me using the handle Julius_RRG.
RRG, Relative Rotation Graphs, JdK RS-Ratio, and JdK RS-Momentum are registered trademarks of RRG Research.
