Candlestick charting can be very useful if you're a short-term trader, especially when you see a reversing candle at key price support or resistance. Yesterday, we saw a dark cloud cover candle form on more-than-average volume, suggesting to me that AAPL may have topped near-term. Make no mistake, I'm very bullish AAPL, so I'm only talking about a possible near-term pullback. I'd be a buyer on a 20-day EMA test (green arrows below):
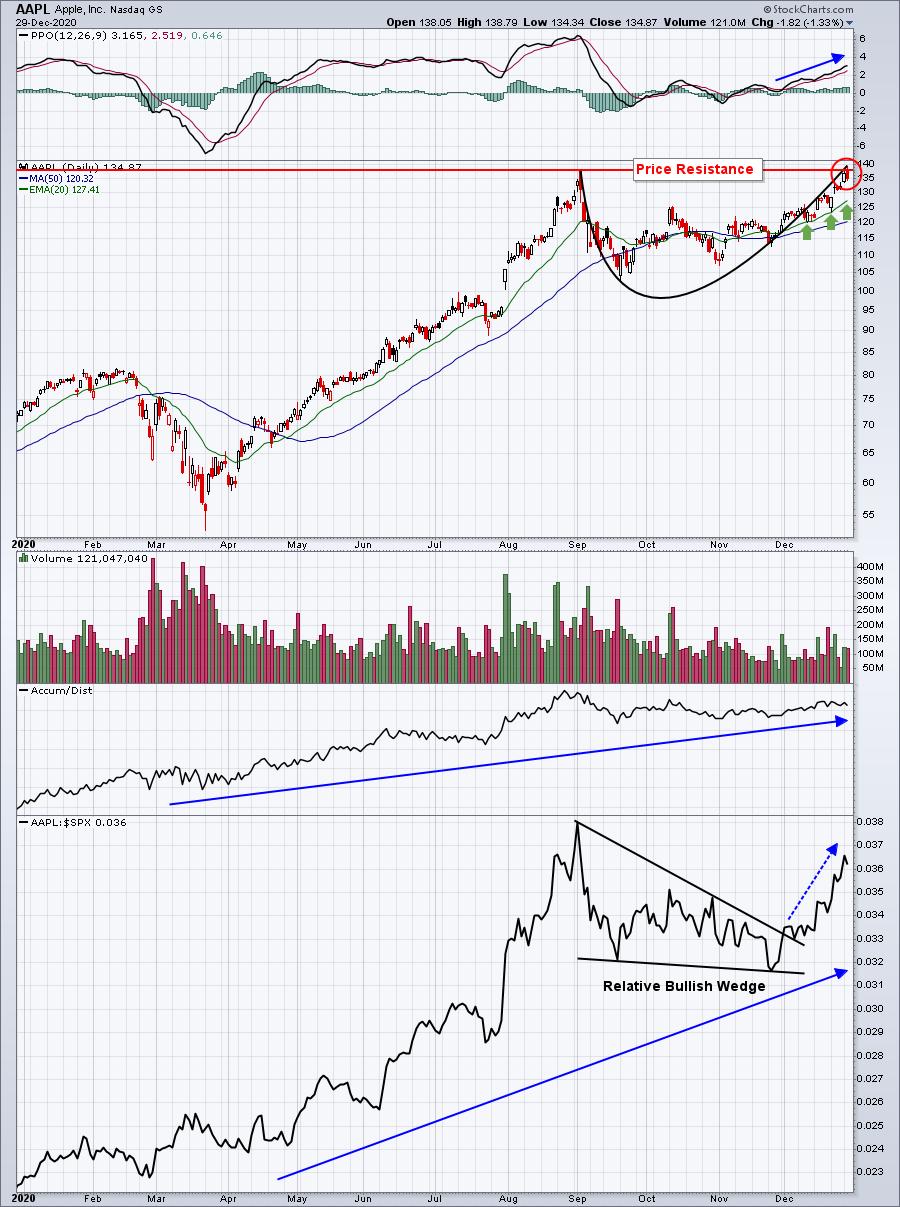
The dark cloud cover is highlighted inside the red circle. Note that it's printed exactly at the price resistance level from the September top. There are plenty of bullish signals here, so again, any weakness should be viewed as short-term and an opportunity for entry.
If you're unfamiliar with candlesticks, here's the explanation of a "dark cloud cover" from ChartSchool:

Note that "further weakness is required for bearish confirmation." A break above AAPL's intraday high on Tuesday negates this pattern, while a move below Tuesday's intraday low confirms it. Because of AAPL's weighting, it has a significant impact on the performance of both the QQQ and XLK - ETFs that track the NASDAQ 100 and the technology sector, respectively.
Happy trading!
Tom Bowley, Chief Market Strategist
EarningsBeats.com
"Better Timing. Better Trades."


