 On the weekly Relative Rotation Graph for US sectors, the Financial sector is gradually improving more and more, with the tail having just crossed over into the leading quadrant.
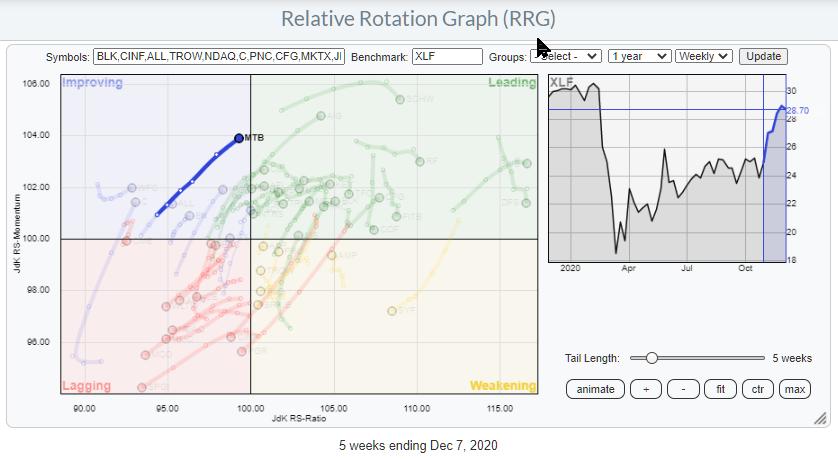
Zooming in on the RRG for the constituents of the Financial sector against XLF, we see a high concentration of banking stocks inside the leading quadrant, while a few are inside improving and heading towards leading.
One of those banking stocks inside improving is MTB, whose tail is almost straight over the last five weeks. The distance between the weekly data points, the RRG-Velocity, is increasing, which indicates that the move is picking up steam.
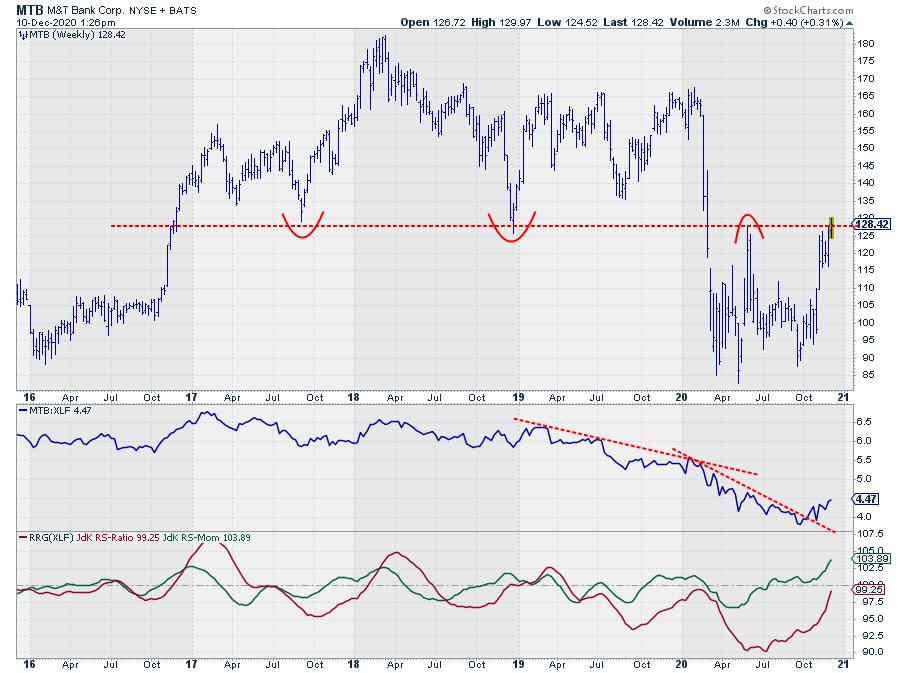
Switching to the price chart for MTB in combination with relative strength and the RRG-Lines reveals an important horizontal resistance level around current levels. That is, the area between $125-$130.
This area showed up as support in 2017 and late 2018. It was broken downward at the start of this year, then showed up as resistance again in June. Now it is again showing up as resistance after the recent rally out of the October low.
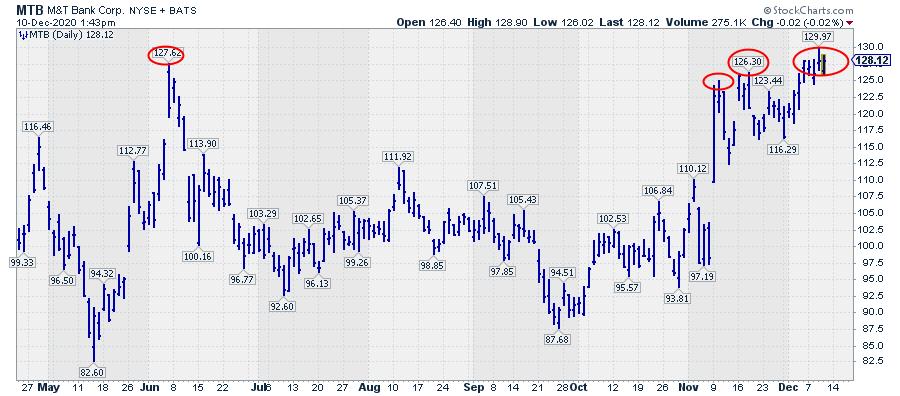
The daily chart shows this in more detail. After the initial jump in November, MTB kept pushing against that overhead resistance area. A clear break higher and away from these levels will free the way for more upside while, at the same time, protecting the downside.
The relative strength against XLF suggests that there is more relative strength ahead, which makes MTB a very interesting stock, especially once $130 can be cleared.
#StaySafe, --Julius
My regular blog is the RRG Charts blog. If you would like to receive a notification when a new article is published there, simply "Subscribe" with your email address.
Julius de Kempenaer
Senior Technical Analyst, StockCharts.com
Creator, Relative Rotation Graphs
Founder, RRG Research
Host of: Sector Spotlight
Please find my handles for social media channels under the Bio below.
Feedback, comments or questions are welcome at Juliusdk@stockcharts.com. I cannot promise to respond to each and every message, but I will certainly read them and, where reasonably possible, use the feedback and comments or answer questions.
To discuss RRG with me on S.C.A.N., tag me using the handle Julius_RRG.
RRG, Relative Rotation Graphs, JdK RS-Ratio, and JdK RS-Momentum are registered trademarks of RRG Research.


