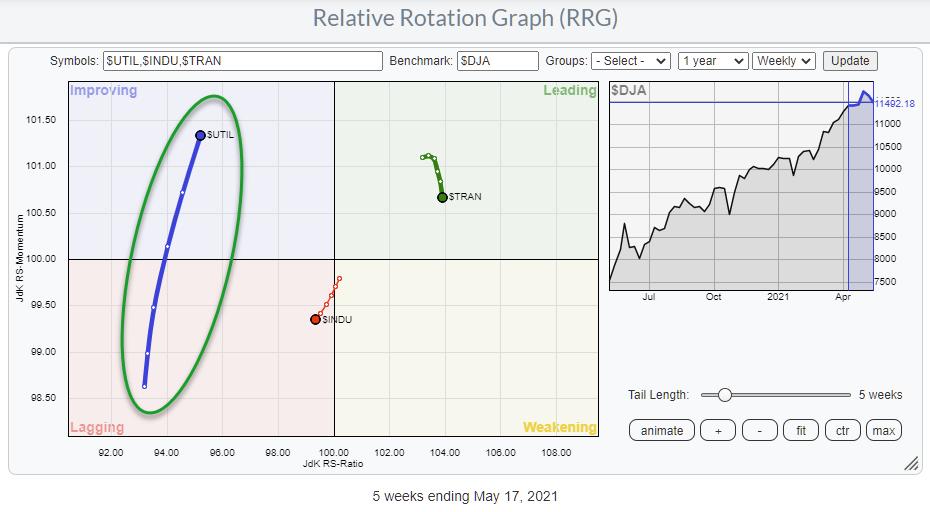
A great way to keep an eye on offense vs. defense is using the Relative Rotation Graph above, which shows the three main Dow indexes against the Dow Jones Composite Average.
This RRG is available from the drop-down on the RRG page under <DJ Composite 65>. As the RRG plot is limited to 50 securities at the same time, this one will show you the rotation of the three main indexes that make up the DJ Composite 65:
- DJ Industrials (30 stocks)
- DJ Transportation (20 stocks)
- DJ Utilities (15 stocks)
All three of these indexes are also available from the dropdown; they will show you the individual members of that sector against the sector index.
I use this RRG often to get a quick idea of risk-on vs. risk-off for the market in general. Looking at the RRG at the moment, it is the long tail on the Utilities index that is standing out. Long tails equal power, they tell us that there is momentum behind the move. But, more importantly, the RRG-Heading for Utilities is in the 0-90 degree area, which is positive, while the shorter tails on Industrials and Transportation are not.
A simple takeaway from this RRG is that the market is still in a risk-off mode, with defense (utilities) improving versus offense!
#Staysafe, --Julius
My regular blog is the RRG Charts blog. If you would like to receive a notification when a new article is published there, simply "Subscribe" with your email address.
Julius de Kempenaer
Senior Technical Analyst, StockCharts.com
Creator, Relative Rotation Graphs
Founder, RRG Research
Host of: Sector Spotlight
Please find my handles for social media channels under the Bio below.
Feedback, comments or questions are welcome at Juliusdk@stockcharts.com. I cannot promise to respond to each and every message, but I will certainly read them and, where reasonably possible, use the feedback and comments or answer questions.
To discuss RRG with me on S.C.A.N., tag me using the handle Julius_RRG.
RRG, Relative Rotation Graphs, JdK RS-Ratio, and JdK RS-Momentum are registered trademarks of RRG Research.


