When we endure a lengthy bear market, many technical buy signals can be thrown right out the window. They don't work as pessimism and outright fear take over the market; instead, you have to be prepared for reversals based on extreme sentiment readings.
Historically, Volatility Index ($VIX) readings in the 30-40 range have produced key market bottoms -- at least in the short-term. But my favorite is the 5-day moving average of the equity-only put-call ratio ($CPCE). Every significant bottom this century has occurred with this 5-day moving average hitting AT LEAST .75. Nearly every one has seen this 5-day moving average hit .80. We were at .82 on the mid-June market bottom and we're back near .80 now. Check this out:
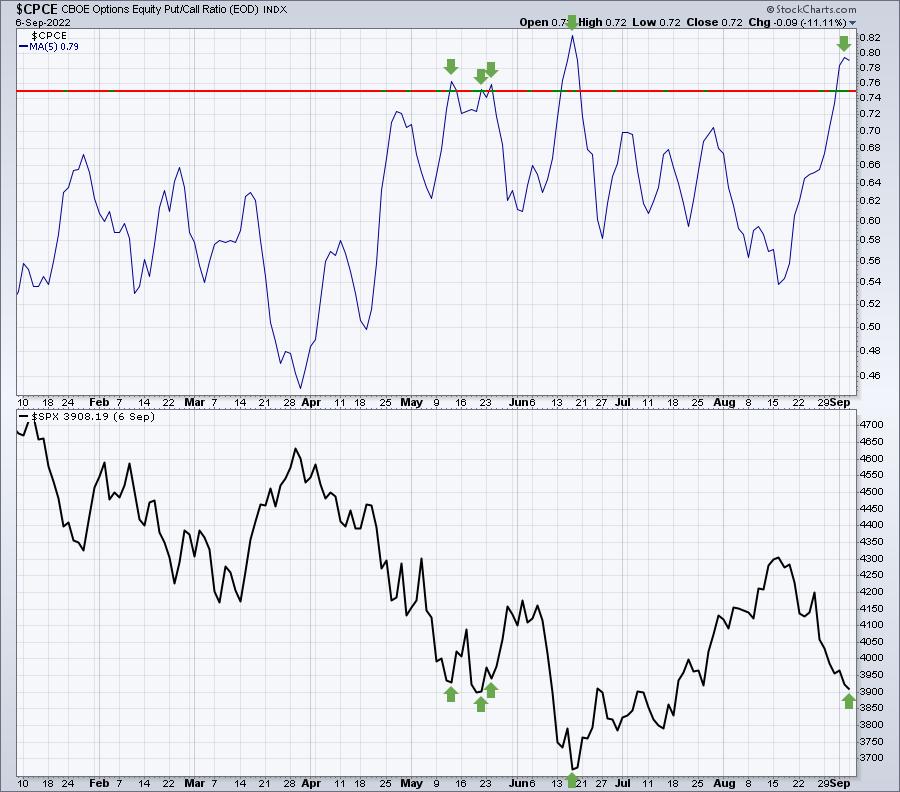
Each time in 2022 that we've seen the 5-day moving average of the equity-only put-call ratio move above .75, we've seen at least a short-term rally in U.S. equities.
I plan to feature stocks that should benefit during any short-term rally in our FREE EB Digest. You can subscribe by CLICKING HERE and providing your name and email address. There's no credit card required and you may unsubscribe at any time.
Happy trading!
Tom


