A year or so ago, the thought of investing in coal companies may not have crossed your mind. Yet coal stocks seem to be playing a part in leading the Energy sector higher, at least for the short term.
One chart that looks particularly interesting today is Peabody Energy Corp. (BTU). The stock price rose over 200% from December 2021 to April 2022, reaching a high of $33.29. From there, the price movement stalled, with the stock moving sideways with lower highs. So the general trend was down. However, beginning July, there was a pattern of higher lows, which indicated a sign of recovery. Over the next few months, a long-drawn symmetrical triangle formed on the price chart (see chart 1).
What Has BTU Got Going For It?
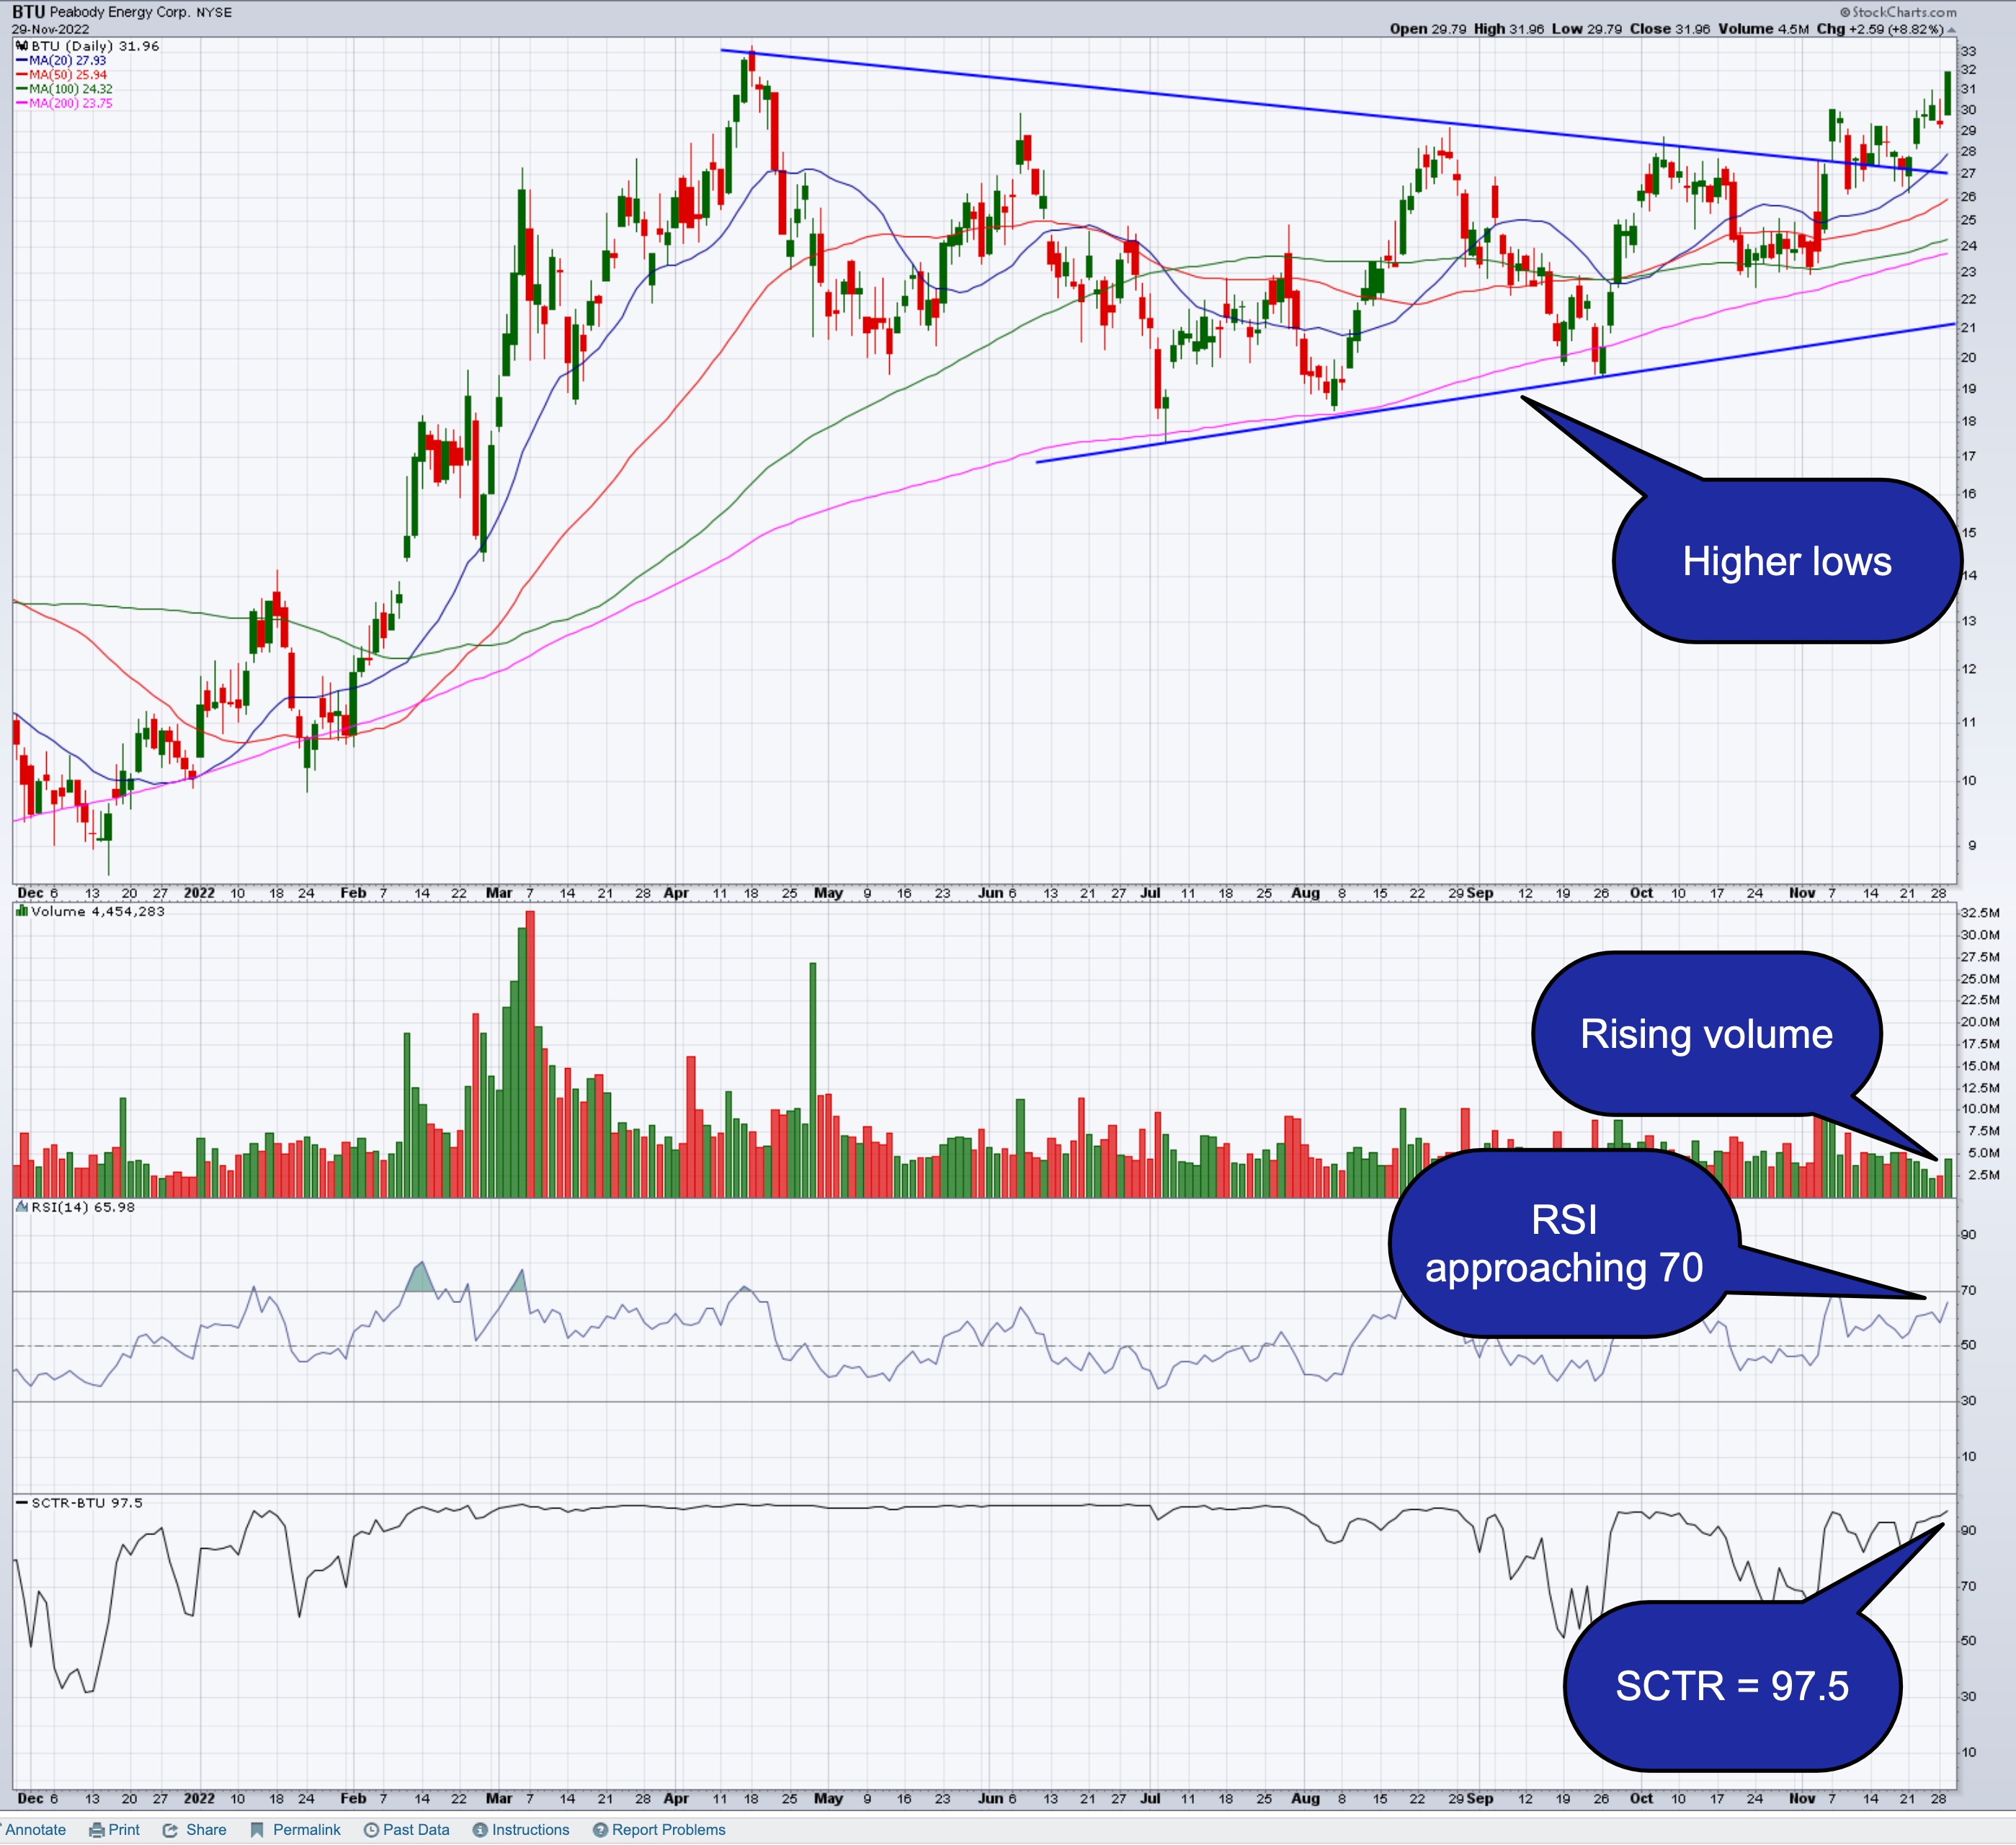
BTU closed at 31.96, the high of the day. Other chart points to note are:
- Price has broken above the downward-sloping lower highs line
- The 20-, 50-, 100-, and 200-day moving averages are upward-sloping
- Rising volume on the last price bar
- Relative strength index (RSI) is approaching the 70 overbought threshold
- StockCharts Technical Ranking (SCTR) line is at 97.5
You could argue that BTU is now pretty close to its 52-week high. That could mean the stock could reverse and head lower. But, if it breaks above the high of $33.29 with strong follow-through -- that is, moving averages maintain their upward slope, volume continues to rise, and RSI moves above 70 -- BTU could be a stock to keep on your radar, at least for the short term. So set up an alert on your StockCharts platform for the price break.
Remember, you'll want to keep those stops tight, since we are entering what could be a volatile week in energy stocks.
How to Set a Price Alert in StockCharts
- From Your Dashboard select the Alerts button
- Set a new price alert
- Enter BTU in symbol box
- Select Crosses Above for the trigger
- Enter 33.29 in the price box
- Select how you want to be notified

Jayanthi Gopalakrishnan
Director, Site Content
StockCharts.com
Disclaimer: This blog is for educational purposes only and should not be construed as financial advice. The ideas and strategies should never be used without first assessing your own personal and financial situation, or without consulting a financial professional.
Happy charting!


