If you've logged into your Facebook account recently, you may have noticed a bunch of targeted reels. No, it's not TikTok. This just shows that Meta Platforms (META), parent company of Facebook, is rolling up its sleeves and getting aggressive in the advertising space. META has lost some of its competitive edge in the ad space, especially with the rise of larger players such as Amazon (AMZN) and Apple (AAPL), plus other short reel video platforms. But it's still got a big player with a large user base.
META's last earnings report was pretty dismal, sending its stock gapping lower to a level the stock hasn't seen since 2016. The company also announced job cuts and a major slowdown in ad spend. And let's not forget the huge—we're talking tens of billions of dollars—investment in the metaverse, which hasn't shown any profits yet.
These factors didn't go down well with META investors. But since reaching a low of around $88 last November, the stock has started to show some signs of recovery (see chart below). So far, in 2023, the stock price has been up around 13%. Last year was rough for META, as it was with other large-cap growth stocks. So a recovery, even if it's slight, can be an encouraging sign. The big question is, will the recovery sustain? If it does, it could help the other players in the same space.
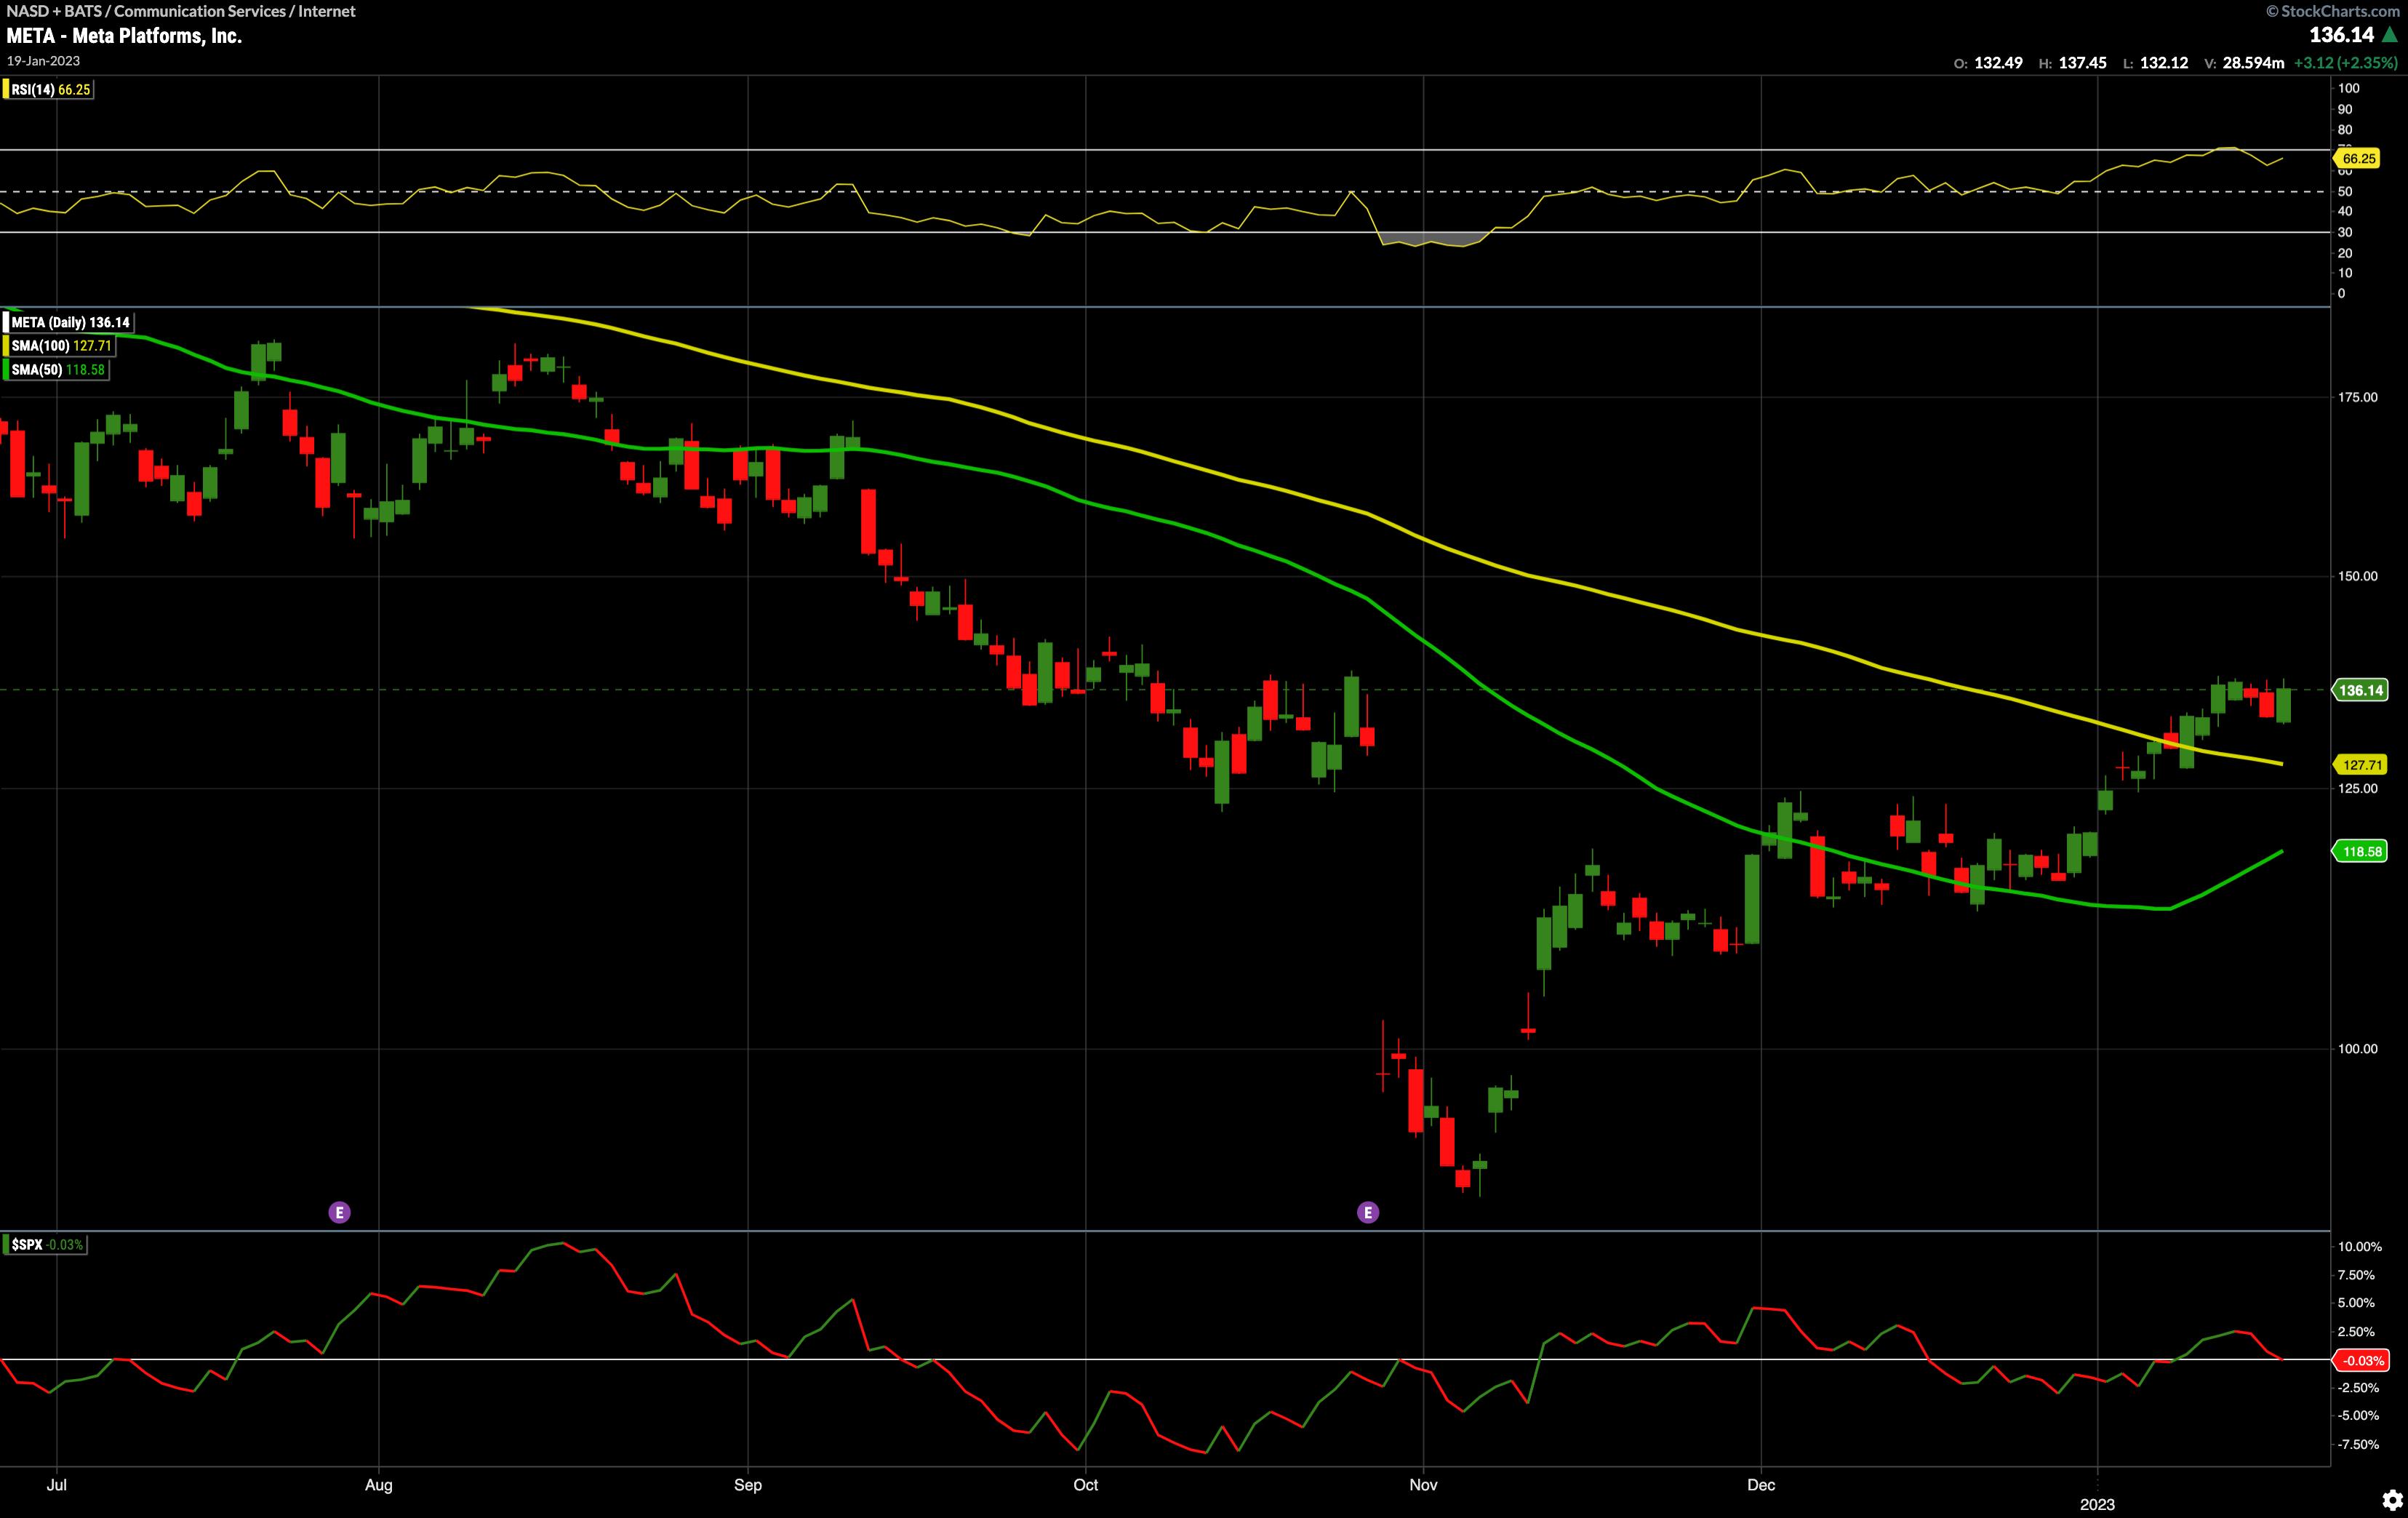
CHART 1: IS META A BUY? It may be too soon to tell, but after being beaten down so badly, it is starting to show signs of recovery. Earnings are coming up, which is likely to impact the stock's price. Add to your ChartLists and watch patiently.Chart source: StockChartsACP. For illustrative purposes only.
What Has META's Chart Got Going For It?
- The 50-day moving average (MA) is trending higher and approaching the 100-day MA. When the 50-day MA crosses above the 100-day MA, you get a golden cross, which is generally an indication of a bullish move.
- The relative strength index (RSI) is approaching its overbought zone (upper sub chart). Watch for it to cross above it; if it sustains that level, that might mean the rally could continue, at least for some time.
- META's relative performance against the S&P 500 index is hovering around the zero line. If the RS line (lower sub chart) starts to turn up and go higher, it would be another indication of the stock's strength.
META is expected to report earnings on February 1, 2023. It'll be interesting to hear if there's any mention of what ad spending is likely to be in Q1 2023. Even the slightest sign of recovery is likely to give the stock price a boost.
It's still too early to determine if the stock is a buy but it's worth adding to your ChartLists. The stock price could go either way depending on its earnings report. As always, tread carefully, and if you do decide to add long META positions to your portfolio, think about how much risk you're willing to take and place your stops accordingly.

Jayanthi Gopalakrishnan
Director, Site Content
StockCharts.com
Disclaimer: This blog is for educational purposes only and should not be construed as financial advice. The ideas and strategies should never be used without first assessing your own personal and financial situation, or without consulting a financial professional.
Happy charting!


