SNAP's got a new game plan up its sleeve and, depending on how well it fits, it may make or break the stock.
After flat or disappointing earnings reports for most of 2022, mainly due to weak social media ad revenues, SNAP stock has suffered. The stock's price has been in the single-digits territory for the latter half of 2022. But there has been some movement to the upside in SNAP's price which could have been because of more positive company fundamentals, or it could be riding the wave created by Meta Platforms (META).
SNAP has taken a leap by investing in augmented reality (AR) technology, which could be an asset for companies that advertise on the SNAP platform. Imagine virtually trying on a pair of jeans before you buy them. Or making sure an L-shaped desk fits perfectly in your home office before committing to a heavy item purchase. This investment could be the news that reignites investor optimism in the stock, which seems to be starting to take hold (see chart below). But will it stick this time?
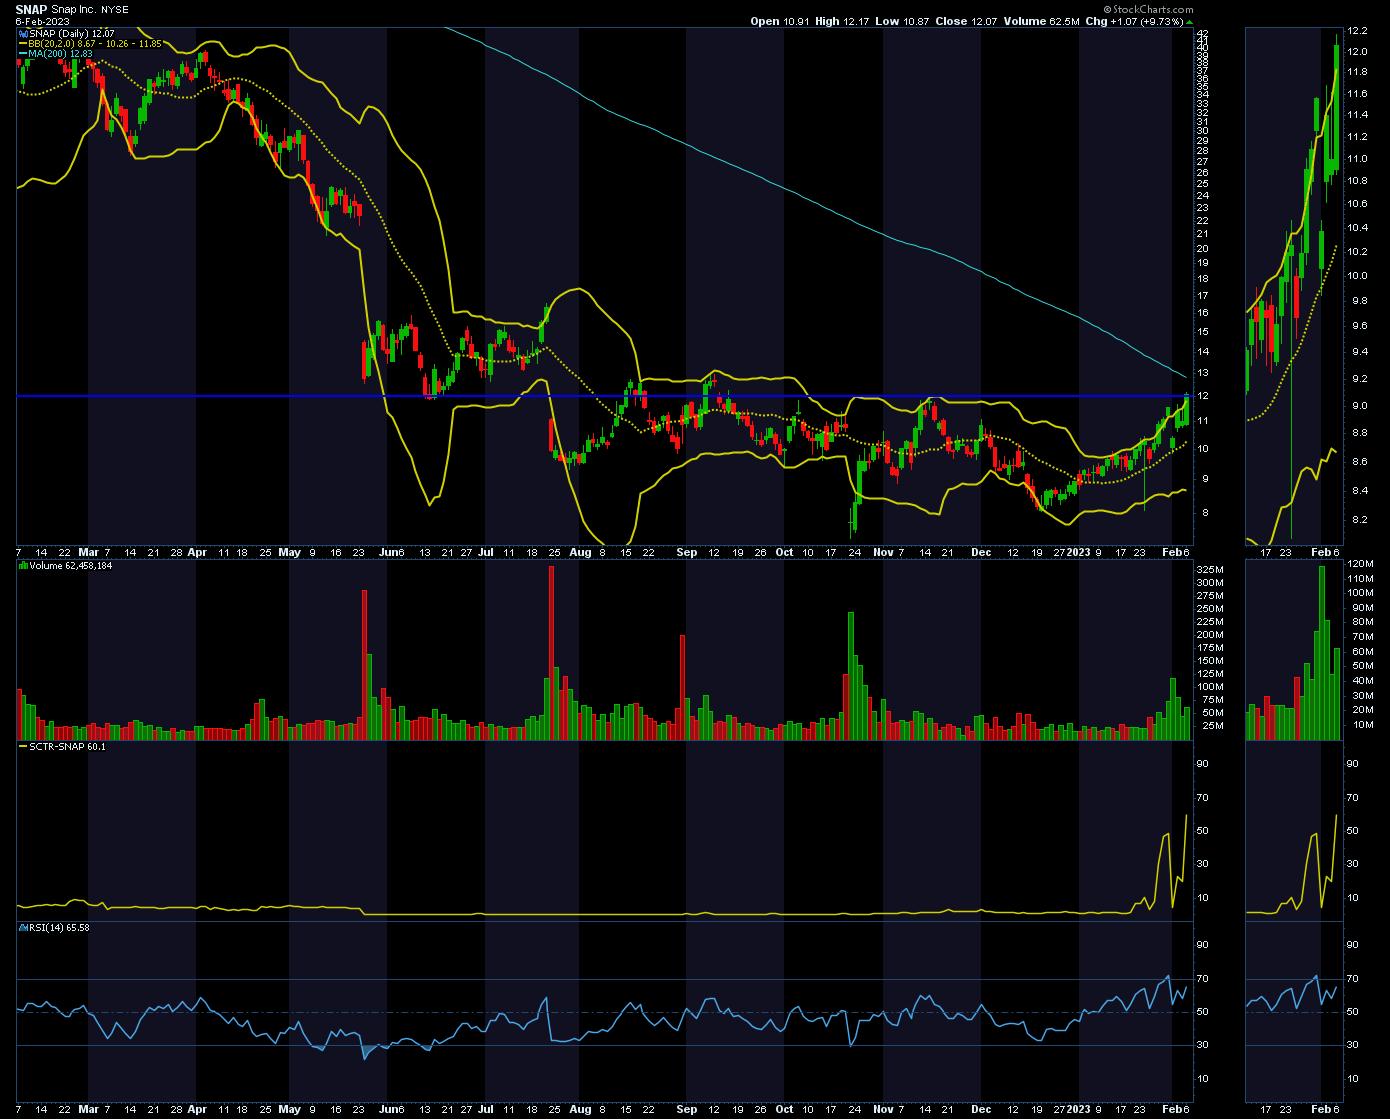 CHART 1: DAILY CHART OF SNAP. The price has moved above the upper Bollinger Band (see thumbnail view on the right side of price chart), which is a sign of strength. The question is if the strength can continue. Click on the chart to see a live version.Chart source: StockCharts.com. For illustrative purposes only.
Snap, Crackle, and Pop
In the above chart of SNAP, you see a few things the stock price has going in its favor.
- Price has exceeded the upper Bollinger Band®, which can be a positive sign. For most of 2023, price has moved along the upper band, but now that it has exceeded it, will price continue walking the band, or will it pull back, like it did the last time this happened?
- SNAP's StockCharts Technical Rank (SCTR) was up by 39.8 points on February 6. That's a big one-day jump, especially after being close to zero for practically all of 2022; whether it can hold on or move higher up its rank remains to be seen.
- The relative strength index (RSI) is climbing up towards the 70 level. This happened more recently on January 31, right before the company announced earnings. But, after a disappointing earnings report, the price gapped down. Will a follow-through in an upward price move occur this time and, if it does, will the RSI remain above 70 for a while? That's something to keep an eye on.
- SNAP's stock price is slightly above its previous November 2022 high. If you go back as far as June 2022, this level was a short-lived support level.
Or, It Could Fizzle
The short-term nature of SNAP's price swings is something to keep in mind if you're considering buying the stock. Since June 2022, every time the stock tried to move higher, it lacked the momentum to push the price higher. Since then, the stock has been moving sideways.
Another point to keep in mind is that the 200-day moving average (MA) is sloping downward (blue line), which means the overall long-term trend is still down. If the stock price moves above the $12 level, the 200-day MA could act as a resistance level.
If you are considering buying SNAP, set an alert for when its price crosses above the 200-day MA. A move beyond that level supported by increased volume, high SCTR, and an RSI that's above 70 could set the stock up for the start of an uptrend. The key would be for the 200-day MA to turn and slope up. Then you can use your own judgment and decide if the stock fits your portfolio and for how long.
Jayanthi Gopalakrishnan
Director, Site Content
StockCharts.com
Disclaimer: This blog is for educational purposes only and should not be construed as financial advice. The ideas and strategies should never be used without first assessing your own personal and financial situation, or without consulting a financial professional.
Happy charting!


