
Hershey's stock has pulled back. If you missed a previous opportunity to own the stock, this may be your second chance. Explore a few simple technical analysis tools that can help determine if the stock presents a buying opportunity.
Are you bummed out that you missed a stock trading opportunity? Upward-trending stocks don't always go up. They're known to pull back, and sometimes the price action at the pullback could give you a second chance.
As an example, Hershey Foods Corp. (HSY) rallied from January 2023 to May 2023. The StockCharts Technical Ranking (SCTR) for HSY has, for the most part, been above 70 for a few months. It's important to note that, since the SCTR crossed above 70 in April, it has managed to stay above the 70 level even after the stock price pulled back. The stock is also performing well relative to the S&P 500 index ($SPX).
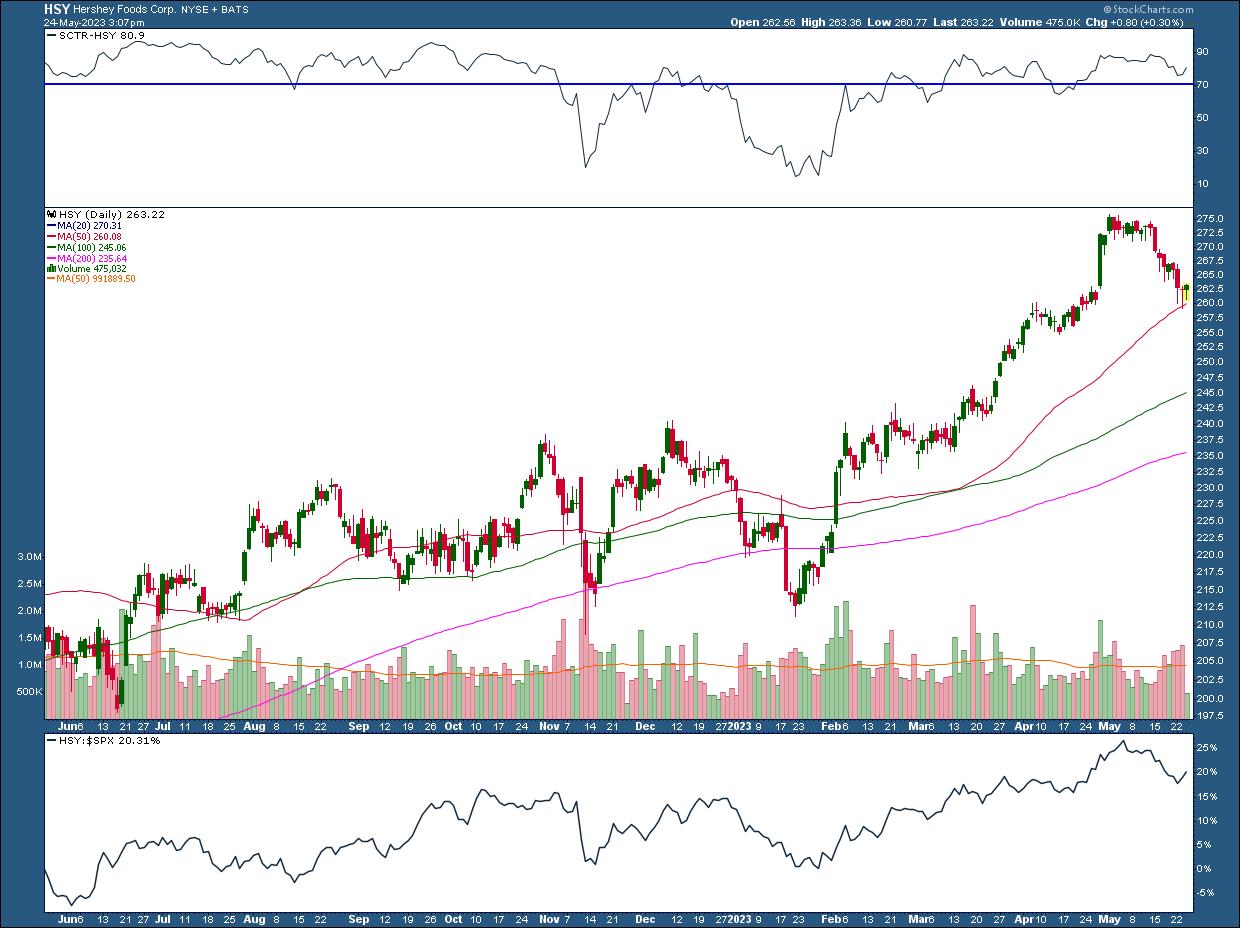
CHART 1: DAILY CHART OF HERSHEY STOCK. The stock price is bouncing off its 50-day moving average. If the support level holds, the stock could reach a high of around $276.Chart source: StockCharts.com (click on chart for live version). For illustrative purposes only.
Hershey's stock has had an interesting ride, reaching a high of $275.81 on May 1. Consumer demand for chocolates and other sweet and salty snacks has increased, as indicated in the company's recent earnings calls. Plus, the company pays dividends to its shareholders. Check out the Symbol Summary tool in the StockCharts charting platform for dividend info.
Zeroing In: Daily Price Action in HSY Stock
Since reaching its May high, the stock has traded sideways in a narrow range for a couple of weeks until it sold off, bringing its price close to its 50-day moving average (MA).
- If the support of this moving average holds, the stock could bounce back and revisit its highs.
- If the SCTR stays above 70 and the stock's relative performance against the S&P 500 continues to be strong, there's a chance HSY could move higher. So, if you missed out on the earlier rally, this could be another opportunity.
The downside: The stock could move lower to its 100-day MA. If the SCTR and relative strength drop, any reversal of the downward trend would be void for a while. Things can always change.
A Weekly Perspective of HSY Stock
The weekly chart of HSY shows that the upward trend is still in play. It helps to look at the last two occasions when the SCTR experienced sharp dips below the 70 level. In both those instances—November 2022 and January 2023—the stock fell to its 50-week MA and rebounded. But the price is quite a ways from the 50-week MA, so, in this case, it would be helpful to add a shorter period MA to the chart. In the chart below, you see a 25-week, which was added because price hugged it pretty closely during the rally from 2020.
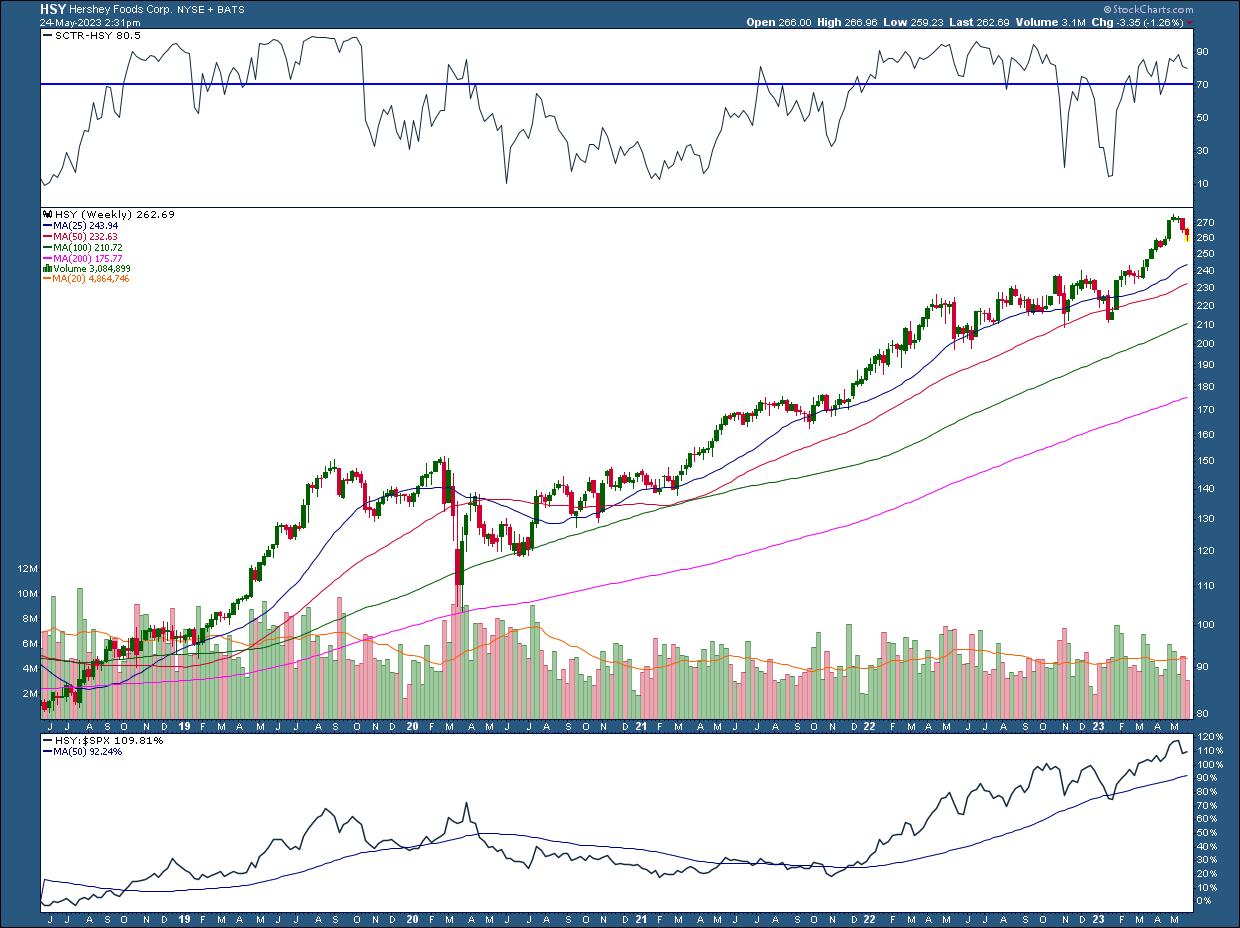
CHART 2: WEEKLY CHART OF HERSHEY STOCK. The weekly chart shows the long-term upward trend is still moving higher.Chart source: StockCharts.com (click on chart for live version). For illustrative purposes only.
- The SCTR is above the 70 level, which is a positive indication for the stock price to move higher. If price stays at or above the 25-week MA and the SCTR remains above 70, there's a pretty good chance the stock will continue to rally.
- The 50-, 100-, and 200-week moving averages are trending lower.
- The 50-period moving average overlay on the relative performance, with respect to the $SPX, is trending upward, which is another positive indication for an upward trend.
How to Trade HSY Stock
- Going back to the daily chart, if the stock stays above its 50-day MA, look for an up day with higher-than-average volume. If there's a follow-through of at least one more price bar, it could present a buying opportunity.
- The upside target on the daily chart could be its high of just below $276.
- As long as the SCTR and relative strength against the S&P 500 index stay where they are or go higher, your long trade can remain in play. Consumer demand for Hershey's products is critical, so it's important to follow the company's earnings calls. In an inflationary environment, consumers may decide not to forgo the chocolates and candy. Any signs of slowdown could result in a selloff in the stock.
If you open a long position in HSY, you may not need to place too tight of a stop loss. There are a few months before Hershey's next earnings call. It depends on your risk tolerance level. If the stock trends higher, set trailing stops, and if you have a significant position size, take profits incrementally if conditions warrant such a strategy.
Other Stocks From the Scan
Here are some other stocks that showed up on the large-cap SCTR scan.
- Las Vegas Sands Corp. (LVS)
- Noble Corp. (NE)
- O'Reilly Automotive, Inc. (ORLY)
- Palo Alto Networks Inc. (PANW)
- Restaurant Brands International Inc. (QSR)
- Twilio Inc. (TWLO)
- VeriSign, Inc. (VRSN)
Looking Back at AMZN
On May 16, Amazon.com, Inc. (AMZN) was the featured SCTR scan candidate. Let's look at how that stock is performing.
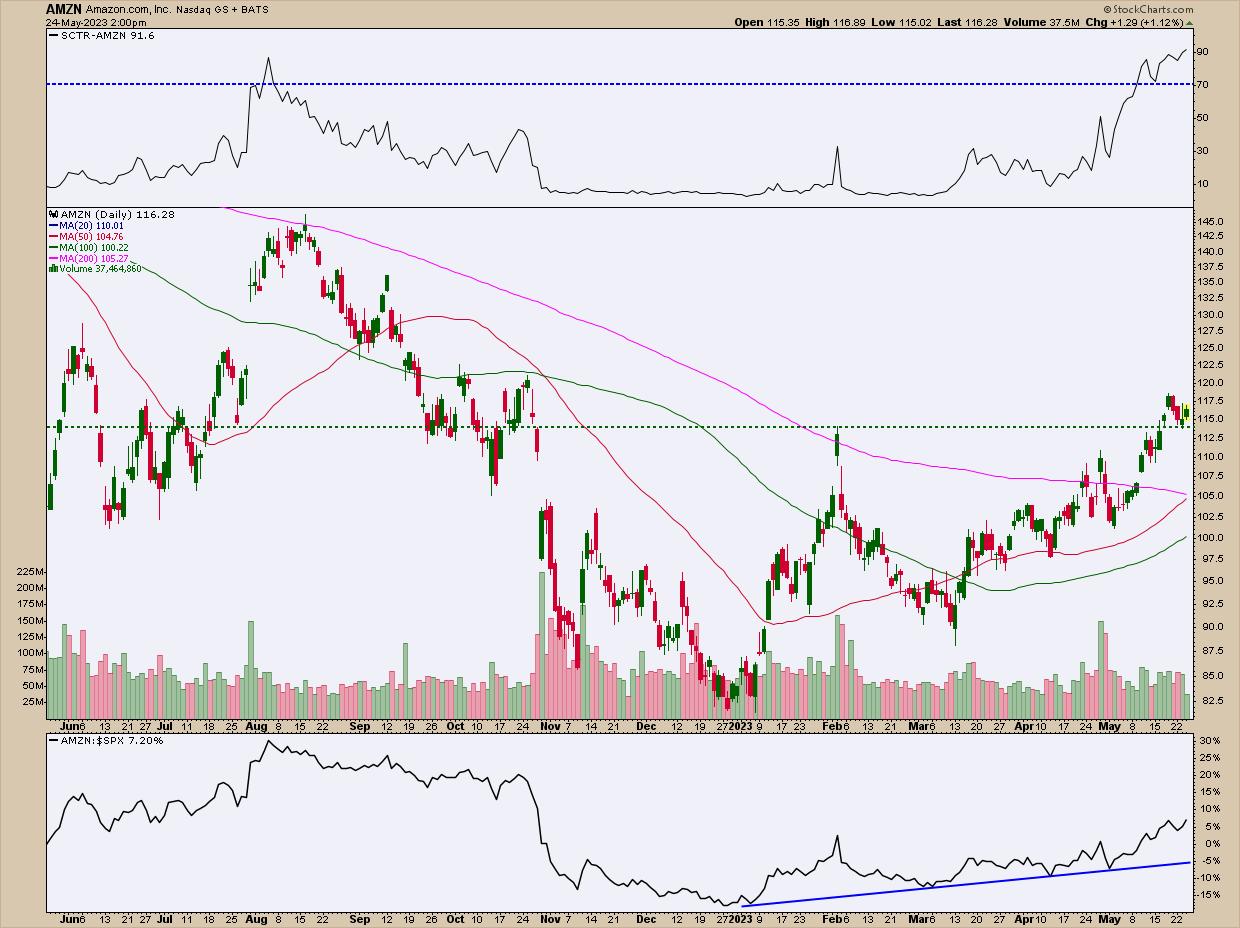
CHART 3: DAILY CHART OF AMZN. If you had opened a long trade when price broke above $113.84, you're probably still holding your positions. A break below the dashed green horizontal line could alter the picture.Chart source: StockCharts.com (click on chart for live version). For illustrative purposes only.
AMZN broke above the $113.84 level (dashed horizontal green line). Since then, it has pulled back and bounced off the green dashed line. If you had opened a long position slightly above $113.84, you're probably holding on to that stock. The SCTR is well above the 70 level, and the stock's performance against the benchmark S&P 500 is rising.
A change in any of the above criteria could be a reason to take at least some positions off the table.
SCTR Crossing Scan
[country is US] and [sma(20,volume) > 100000] and [[SCTR.large x 76] or [SCTR.large x 78] or [SCTR.large x80]]
Credit goes to Greg Schnell, CMT, MFTA.

Disclaimer: This blog is for educational purposes only and should not be construed as financial advice. The ideas and strategies should never be used without first assessing your own personal and financial situation, or without consulting a financial professional.
Happy charting!


