
The market's pulling back, but you expect the decline to be short-lived. You believe it's a mere dip, so you're scanning the market for a few stocks that might be on the verge of a strong upside reversal. One pattern you might want to consider for this type of setup is a Bullish Engulfing candlestick pattern that's bucking a near-term downtrend.
In case you're not familiar with this common pattern, the bullish engulfing is made up of two candle lines. The first line represents a down day (black or red, depending on your candlestick color preferences) while the second is an up day (white or green). The second line is taller than the first; hence, it "engulfs" the total body of the previous candle.
What Makes the Bullish Engulfing Pattern a Strong Reversal Indicator?
- It signals a big change in market mood. This pattern involves two candlesticks, the second one covering the first one completely. This suggests that people have stopped selling and started buying, pushing the price up more than it was pushed down before.
- Buying pressure is rising. The second candlestick being bigger and covering the first one shows us that people aren't just buying, but buying a lot (at least, in theory).
- Flipping the trend. The pattern tends to be a bigger disruption if it shows up after a decline, as its contrarian gesture tends to be a little more dramatic.
- Check the volume. If the bullish engulfing candle occurs on higher volume, it can further validate the strength of the reversal, as it suggests a strong level of participation among buyers.
A few more things to note is that this pattern happens quite often, meaning you'll be able to take advantage of it more frequently than other patterns in the market. And according to technical analyst Thomas Bulkowski, the pattern tends to indicate an upward trend roughly 63% of the time (which is a pretty favorable stat).
How To Scan for a Bullish Engulfing Pattern
Go to Member Tools
Scroll down to and click on Advanced Scan Workbench
Click on New
Paste the following code:
[type = stock]
AND [Daily SMA(20,Daily Volume) > 500000]
AND [country is US]
AND [Daily Bullish Engulfing is true]
AND [Downtrend is true]
Run the scan
This scan generated over 40 results. Note: You can save your Scan results to a ChartList.
Let's take a look at one stock that most investors are familiar with: Walmart (WMT).
Trading WMT's Bullish Engulfing Reversal
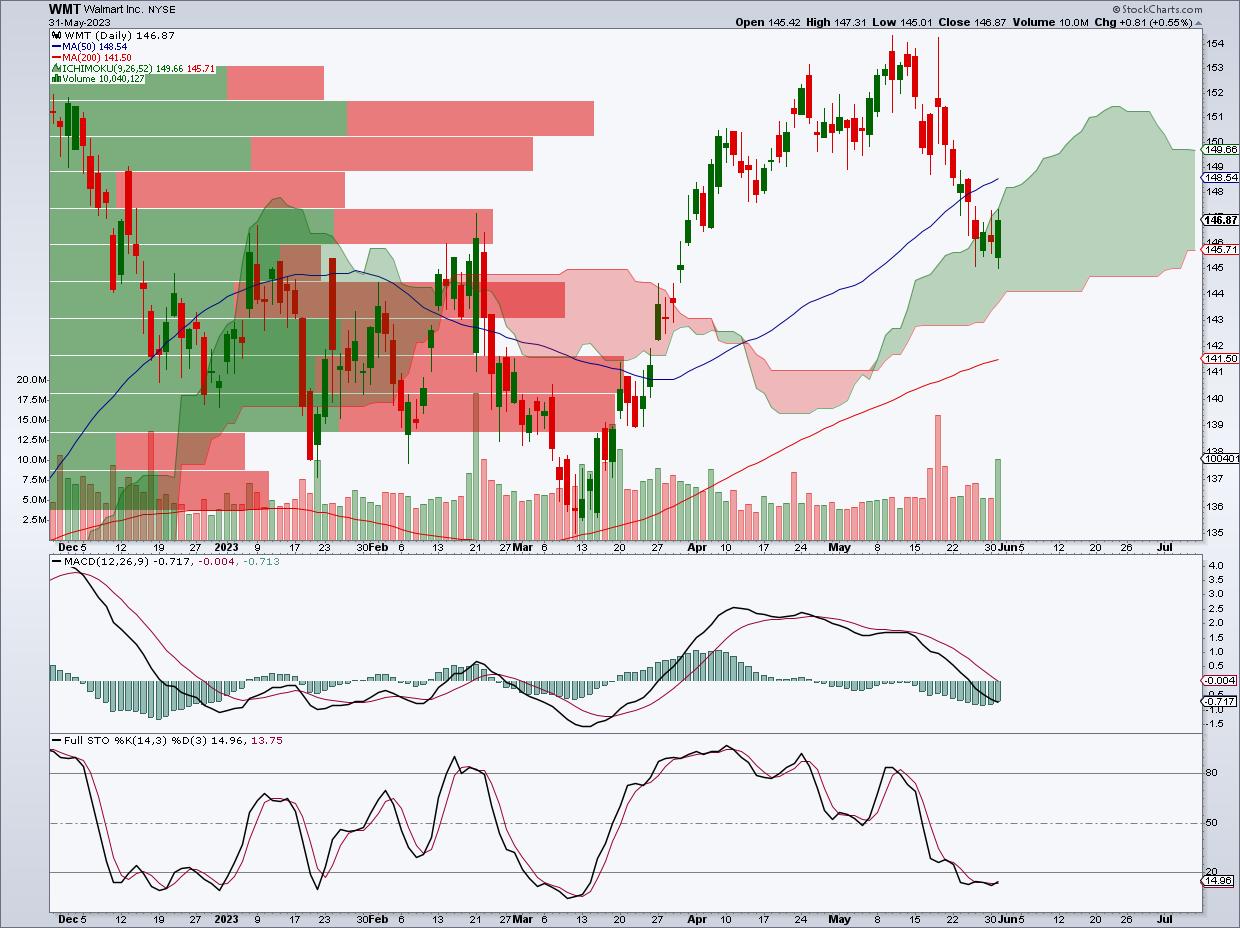
CHART 1: CHART OF WALMART STOCK. Volume by Price, Ichimoku Cloud, and the 50- and 200-day moving averages help to identify potential support and resistance levels for WMT stock.Chart source: StockCharts.com (click chart for live version). For educational purposes only.
Note the following in the above chart:
- The bullish engulfing candle signaled a reversal right in the middle of a green and widening Ichimoku Cloud, which can be interpreted as a strong and bullish support level.
- The 50-day and 200-day simple moving averages are trending upward in a wide and extended formation.
- Volume by Price, seen at the left of the chart, suggests strong levels of support from the price, where the reversal took place to 140, above which the 200-day SMA sits (another level of support).
- However, the Moving Average Convergence Divergence (MACD) Oscillator and Stochastic Oscillator are giving relatively bearish readings. You want to look for a confirmation of the reversal and its follow-through (which will likely lag behind the price action when/if it happens).
- Also, the volume looks strong, which supports a reversal.
How to Trade WMT's Bullish Engulfing Pattern
For a short-term swing trade, you could enter a long position above the top of the engulfing candle (147.31) and take profits between 151, where Volume by Price indicates potential resistance to 154.35, WMT's 12-month high. Your stop loss would be placed below the engulfing candle at around 145.00.
If you were looking to enter WMT for a longer-term hold, you might want to place your stop loss below the current 200-day SMA (to avoid getting stopped out too easily). Your take-profit level will likely vary according to your investment return goals for this particular stock.
Other Stocks From the Scan
Here are some other notable stocks that showed up on scan.
- CME Group (CME)
- Redfin (RDFN)
- Intercontinental Exchange Group (ICE)
- New Gold (NGD)
- Verizon Communications (VZ)
Remember that the technical and fundamental environment surrounding each scan selection will vary. Not every bullish engulfing pattern will be the same. Although they indicate the potential for a trend reversal, you have to check this thesis against other technical factors at play.
The Bottom Line
Understanding and leveraging technical patterns such as the Bullish Engulfing Pattern can significantly boost your trading choices and enhance your decisions. Just remember that trading isn't solely about spotting patterns. It also demands a comprehensive understanding of market dynamics and a strategic approach to risk management. So while you're looking for the next trade based on this particular scan, ensure you also consider the broader market context, confirm with other technical indicators, and keep your trading objectives and risk tolerance in mind. Happy trading!

Disclaimer: This blog is for educational purposes only and should not be construed as financial advice. The ideas and strategies should never be used without first assessing your own personal and financial situation, or without consulting a financial professional.
Happy charting!


