TAKEAWAYS
- Lululemon stock could move higher in sync with the Consumer Discretionary sector
- LULU is trending higher above its 200-week moving average
- LULU could find support at its 50-day simple moving average before moving higher

Athleisure wear became trendy during the pandemic—what's not to like about being comfortable and fashionable at the same time? But even post-pandemic, the "casual mixed with health and wellness" look is still trendy. And one of the stocks riding this fashion wave is Lululemon Athletica, Inc. (LULU).
The stock was a StockCharts Technical Rank (SCTR) scan candidate on June 27. The company has had its share of challenges, but it has overcome those headwinds and gained a huge following. What makes the stock a trading candidate?
The Big Picture: Analyzing the Consumer Discretionary Sector
Owning a Lululemon branded item would come under the "want to have" vs. the "need to have" category. LULU is in the Consumer Discretionary sector and falls under Clothing and Accessories. Using the Consumer Discretionary Select Sector SPDR ETF (XLY) as a proxy for the sector (see chart below), it's evident that the sector has been moving higher in June. It hit a resistance level at the $167.50 level and pulled back. Price is approaching the 20-day simple moving average (SMA), which could act as a support level.
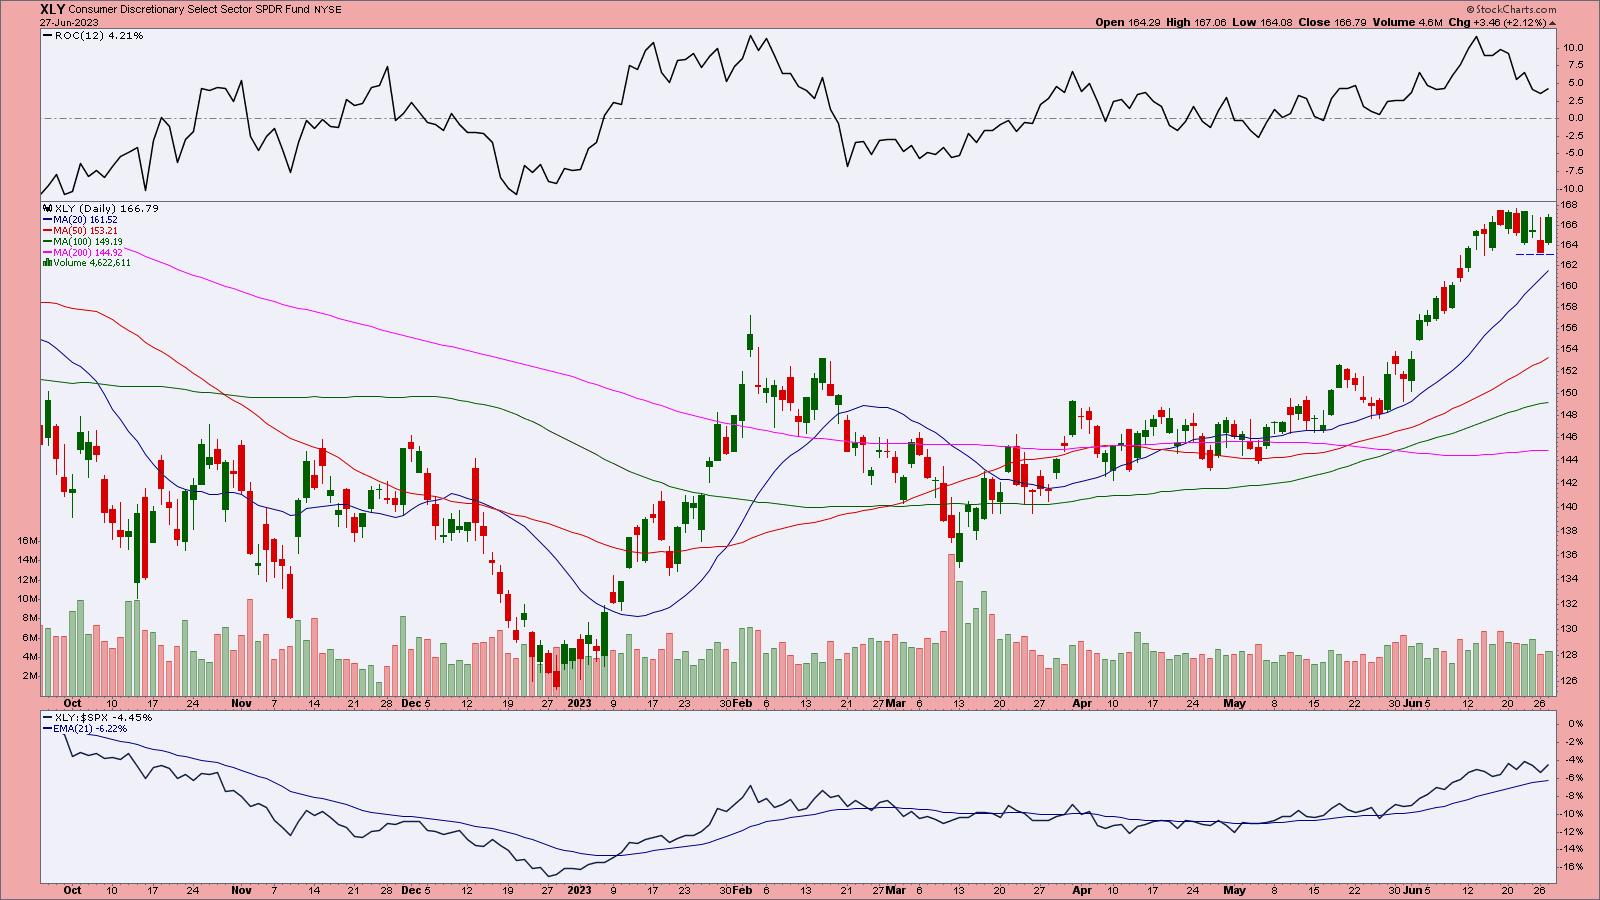
CHART 1: DAILY CHART OF CONSUMER DISCRETIONARY SELECT SECTOR SPDR ETF (XLY). Consumers are gravitating towards discretionary purchases, which is sending discretionary stock prices higher.Chart source: StockCharts.com (click on chart for live version). For educational purposes only.
The rate of change (ROC) has slowed, which is typical during pullbacks. If XLY turns around and reverses after the pullback, you want to see the ROC rising. XLY's relative strength with respect to the S&P 500 index ($SPX) is increasing, which is interesting in an inflationary environment. You'd think that consumers would be spending more on staples (things you need) instead of discretionary (things you want) items. This is an indication that investors are gravitating toward offensive vs. defensive strategies. And for as long as that's happening, discretionary purchases such as athleisure wear are bound to do well.
 How do you monitor offensive vs. defensive sentiment? Ratio charts! All you need to do is enter XLY:XLP (or any symbols related to these two S&P sectors) in the symbol box.
A Weekly Perspective of LULU
The weekly chart (see below) shows that the stock has been in an uptrend since 2019, except for the short-lived decline during the COVID crash in early 2020. The stock has been above its 200-week SMA until mid-2022. There were a few times the stock broke below the 200-week SMA, but it recovered, bounced back above it, and continued trending higher.
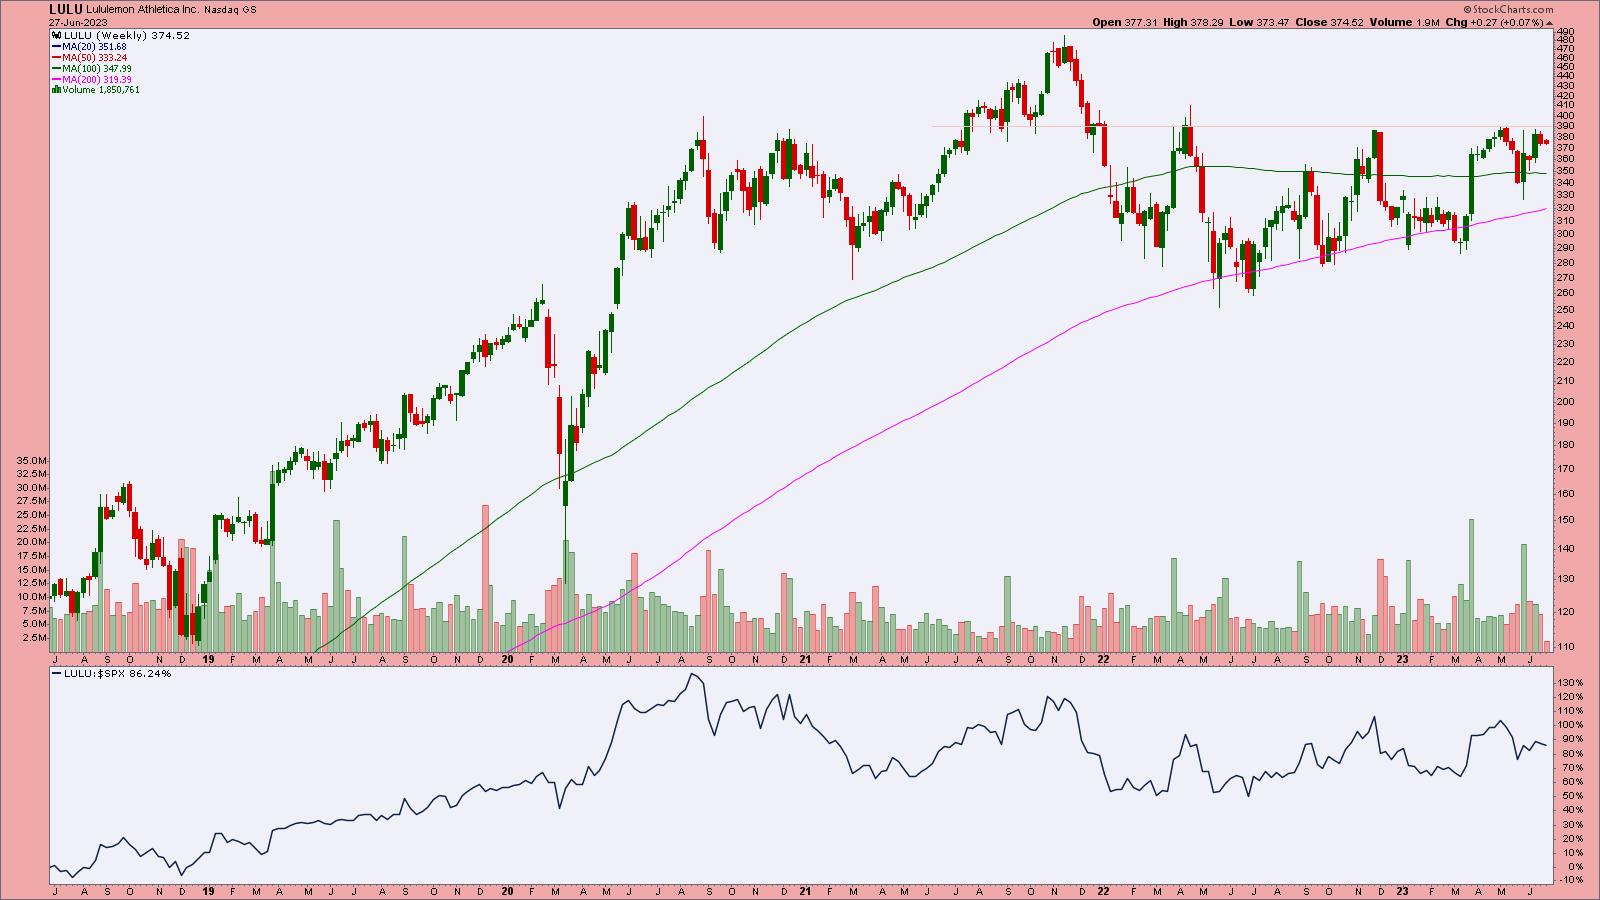
CHART 2: WEEKLY CHART OF LULULEMON. While the stock has been trending upward, it's struggling to break above a resistance level.Chart source: StockCharts.com (click on chart for live version). For educational purposes only.
The stock is trading above its 100-week SMA, which is trending slightly lower. That would be something to keep an eye on. If it turns lower and crosses below the 200-day SMA, the uptrend could reverse. Also keep an eye on the resistance level (pink horizontal line).
LULU's performance vs. the S&P 500 index ($SPX) has been above zero since 2019. So, from a weekly perspective, LULU is trending higher, and if it continues to do so, it could reach its $485.83 high. But will it? To answer this question, it's worth viewing the daily chart.
Zeroing In: Daily Price Action in LULU
The daily chart shows a lot of erratic movements—huge gap ups, huge gap downs. Lululemon's most recent earnings report beat estimates (see chart below) and the company raised guidance. Both factors helped push the stock price higher.
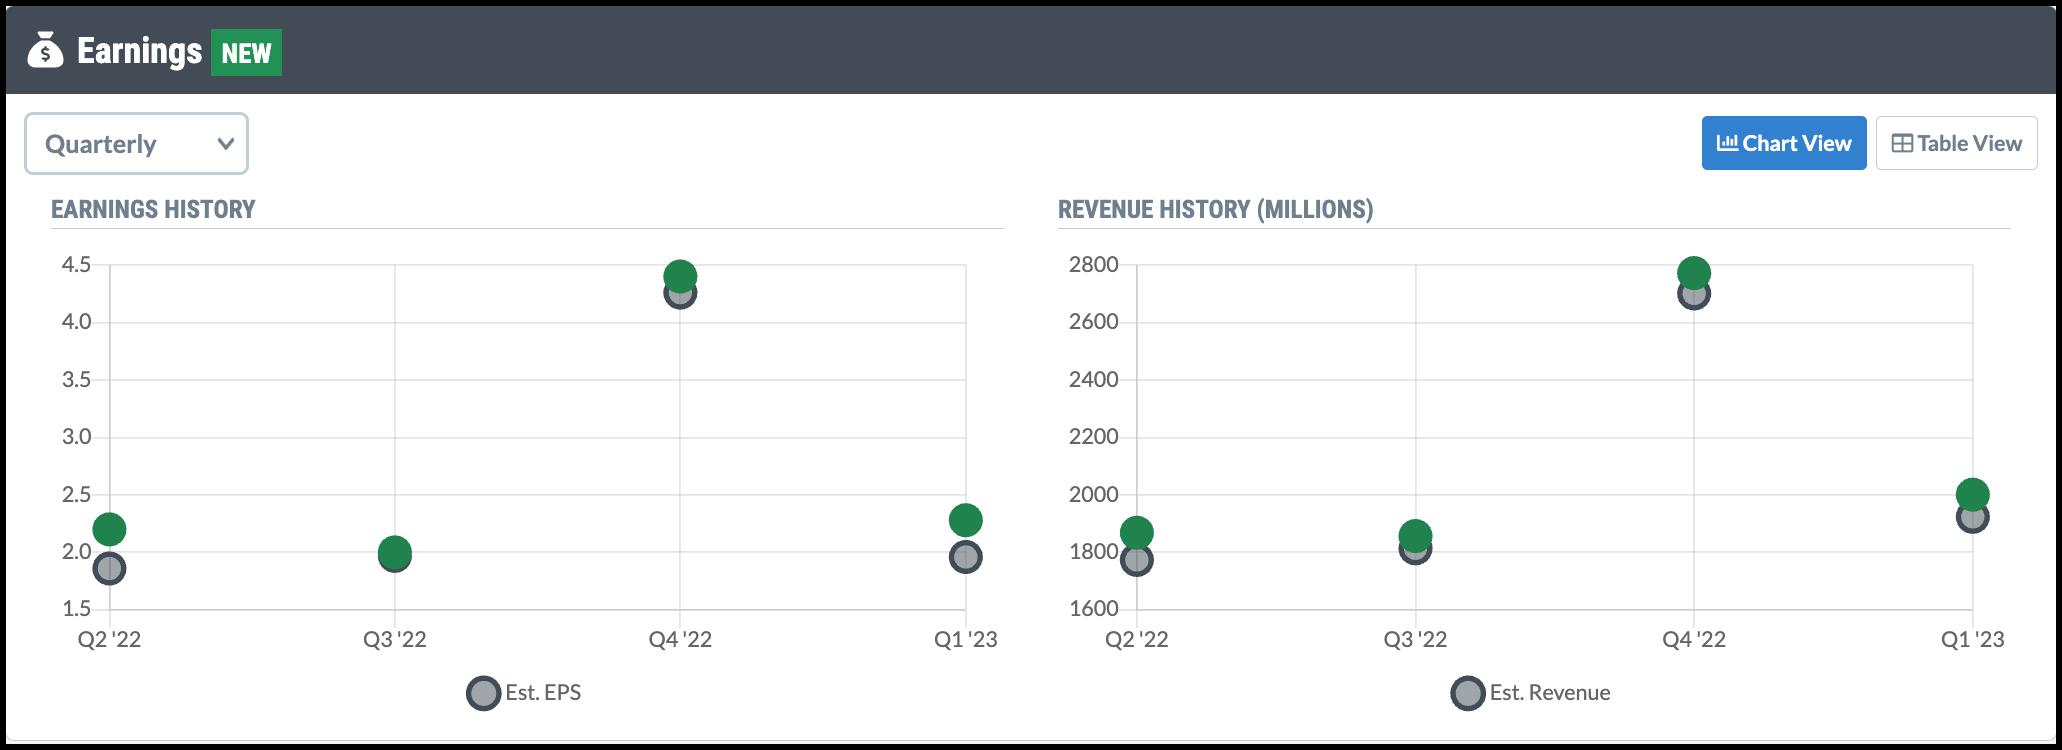
CHART 3: LULU EARNINGS. Last quarter, LULU's earnings and revenues beat estimates. This helped boost the stock price.Chart source: StockCharts.com. For educational purposes only.
The consumer environment tends to be choppy, so it's no wonder the stock price has been, well, choppy. The increased demand for leisurewear keeps the stock resilient.
Looking at the daily chart (see chart below), the SCTR crossed above 70 in mid-June and stayed above it during the stock price pullback. Another point to note is that LULU's performance with respect to the S&P 500 crossed above its 21-day exponential moving average (EMA).
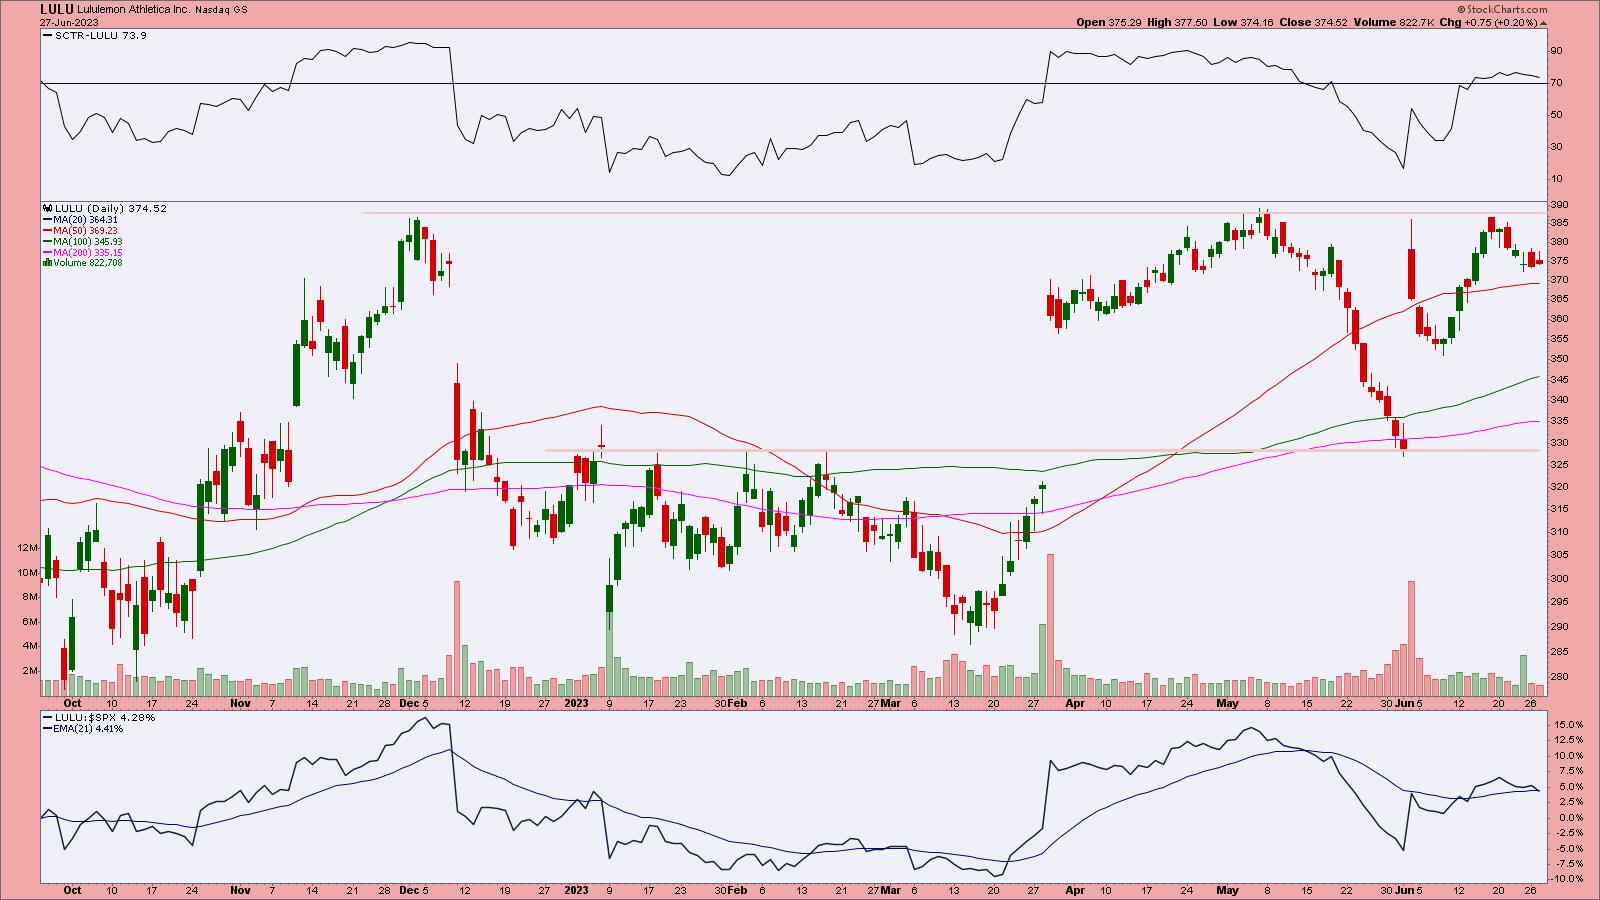
CHART 4: DAILY CHART OF LULU STOCK. Price movement has been choppy, with several gap ups and gap downs. Chart source: StockCharts.com (click on chart for live version). For educational purposes only.
This scenario occurred earlier when the stock gapped up in April. But, in mid-May, the SCTR fell below 70, and the relative strength fell below its 21-day EMA. Given that the stock has a history of gapping up and down, the odds of a similar action occurring are high.
So, How Do You Trade LULU Stock?
At the moment, it looks like LULU is hesitating to go either way.
- The first support level is the 50-day SMA which would take the stock to just below $370. If it breaks below this level, you'll look at the 100-day SMA as the next support level. There are clear support and resistance levels when you look back at past price action. These are represented by the pink horizontal lines. LULU's stock price could remain within any moving average that acts as support and the upper resistance line for a while.
- If the stock drops to the 50-day SMA and bounces back up, it could be a potential short-term trade with an entry just above $370 and a profit target of $387, which is a resistance level. Place a stop just below the 50-day SMA.
- If you are considering a longer-term trade, turn to the weekly chart and make sure that the 100- and 200-week SMAs are turning upward.
Other Stocks From the Scan
Here are some of the other stocks that showed up on the large-cap SCTR scan. Note: The SCTR scan has been modified to include ETFs.
Baidu, Inc. (BIDU)
CrowdStrike Holdings, Inc. (CRWD)
Snowflake, Inc. (SNOW)
Las Vegas Sands Corp. (LVS)
Microchip Technology, Inc. (MCHP)
Vanguard Total World Stock ETF (VT)
iShares MSCI ACWI ETF (ACWI)
Looking Back at WYNN
In last week's SCTR scan article, the featured stock was Wynn Resorts (WYNN). Let's look at how that stock is performing.
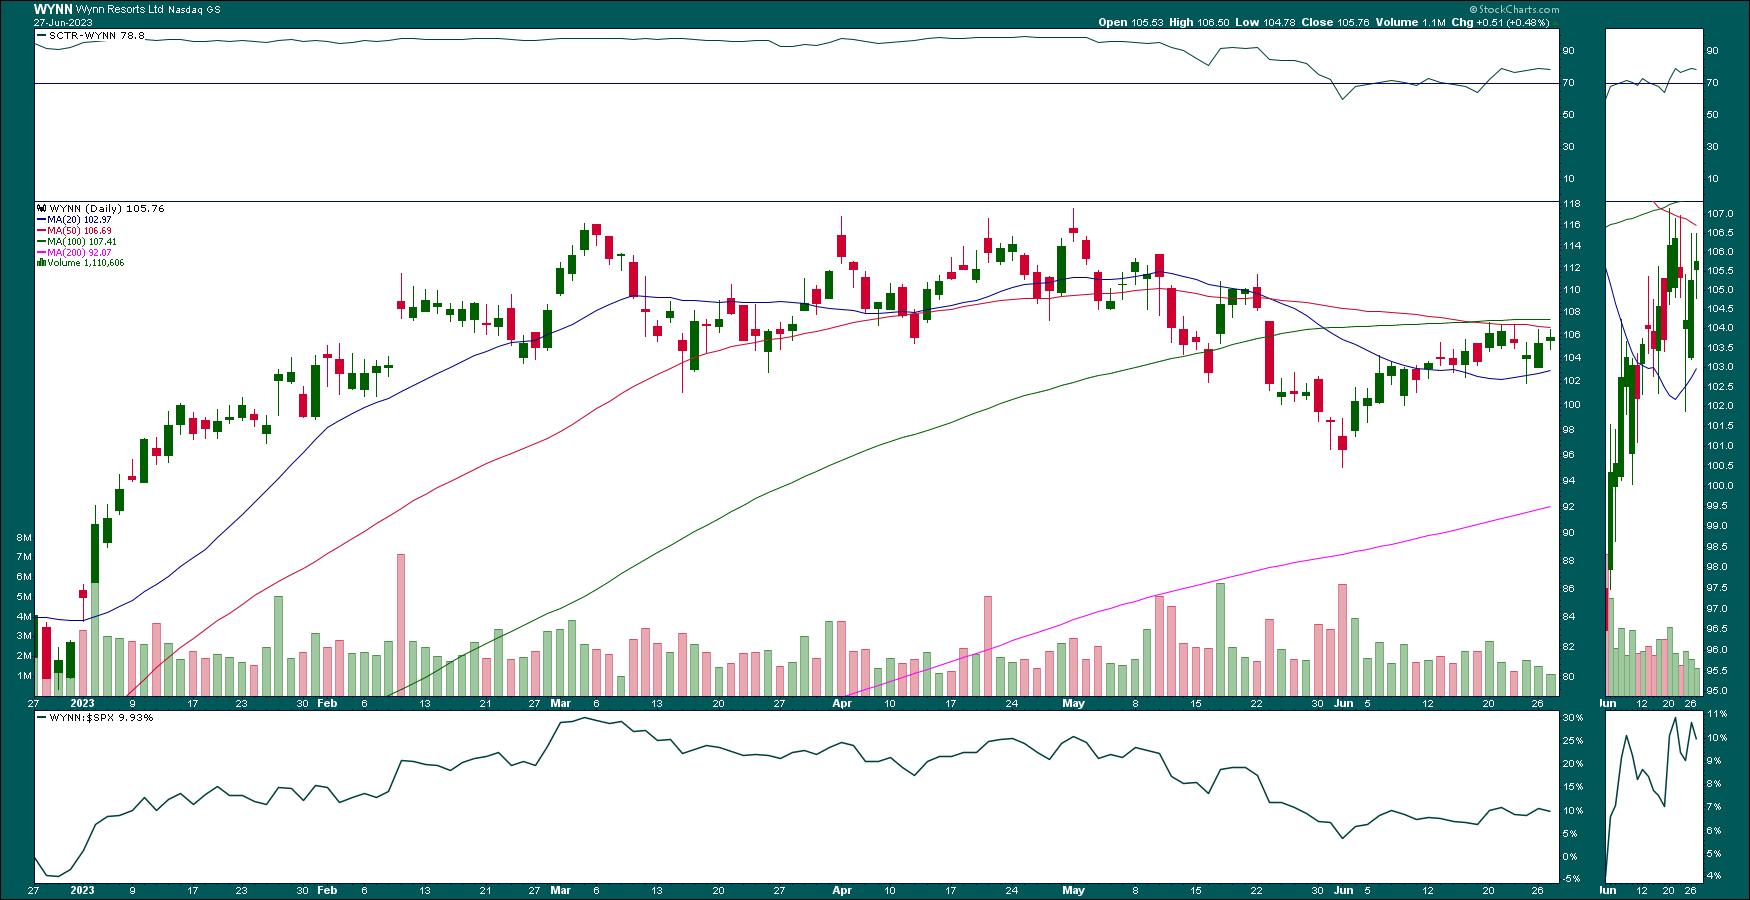
CHART 5: DAILY CHART OF WYNN RESORTS. It's pretty much the same since last week. The stock is trading below its 50-day SMA, which is acting like a strong resistance level.Chart source: StockCharts.com (click on chart for live version). For educational purposes only.
WYNN is still trading below its 50-day SMA, which is acting as a pretty strong resistance level. The SCTR is still above 70 and relative strength is relatively flat. The stock could continue trading sideways for a while. As long as the trading conditions are still valid, it's worth keeping the stock in your ChartLists.
SCTR Crossing Scan
[country is US] and [sma(20,volume) > 100000] and [[SCTR.us.etf x 76] or [SCTR.large x 76] or [SCTR.us.etf x 78] or [SCTR.large x 78] or [SCTR.us.etf x 80] or [SCTR.large x80]]
Credit goes to Greg Schnell, CMT, MFTA.

Disclaimer: This blog is for educational purposes only and should not be construed as financial advice. The ideas and strategies should never be used without first assessing your own personal and financial situation, or without consulting a financial professional.
Happy charting!


