TAKEAWAYS
- Energy stocks are in focus as US crude oil prices continue rising higher
- Oil prices have more room to rise but if prices go too high there may be demand pressures
- Diamondback Energy is getting close to its 52-week high

With Labor Day weekend behind us, it's time to get back to the business of following the stock market.
As the broader stock market indexes show signs of a September slowdown, crude oil is grabbing attention. And when crude oil prices rise, prices at the pump go higher. This isn't great for your wallet. According to a Financial Times report, gas prices in the UK saw a huge jump in August. Gas prices rose in other countries in Europe and Asia, as well as in the US. In addition to the rise in crude oil prices, refining costs will also play a role in rising gas prices, as Saudi Arabia plans to extend production cuts to the end of the year. So, it's not a stretch to expect gas prices to continue rising until the end of the year.
Bottom line: Energy companies and refiners will benefit from the price rise. It may be worth creating an energy-focused ChartList of stocks that look strong from a technical perspective.
One energy company that made it to the StockCharts Technical Rank scan is Diamondback Energy (ticker symbol: FANG). You can find the scan at the end of the article.
All Eyes on the Energy Sector
Before jumping into FANG, it may be worth looking at the state of the oil market. The Energy Select Sector SPDR Fund (XLE) is a good proxy for the energy sector. The chart of XLE below shows that, since August 24, the ETF's price has been rising. On September 5, XLE hit a 52-week high, but gave up some of the gains to close near the low of the day. XLE looked like it was pulling back, but on the next day, September 6, the ETF showed some signs of strength. The overall trend in XLE is still up.

CHART 1: ENERGY IS LOOKING UP. After moving sideways from March to July, XLE started to trend higher and picked up momentum.Chart source: StockCharts.com (click chart for live version). For educational purposes.
The Energy sector can be a barometer of the overall market, particularly as we approach the colder months. A cold winter could mean increased demand for energy, especially in Europe. And if the US economy continues to be resilient and demand for energy increases, it would fuel the oil price rally.
But how much higher is healthy? If crude oil gets close to its 2022 highs—between $120 and $130 per barrel—it may be time to tread cautiously. Crude prices can impact inflation—energy costs go into the production and transportation of most products. If crude prices get too high, airline and transportation companies will feel the pressure.
Oil price still has some ways to go before crude prices get overstretched. Crude oil ($WTIC) trades just below $90 per barrel.
Does that mean investing in energy stocks such as Diamondback Energy is worth considering? Let's look at the daily chart of FANG.
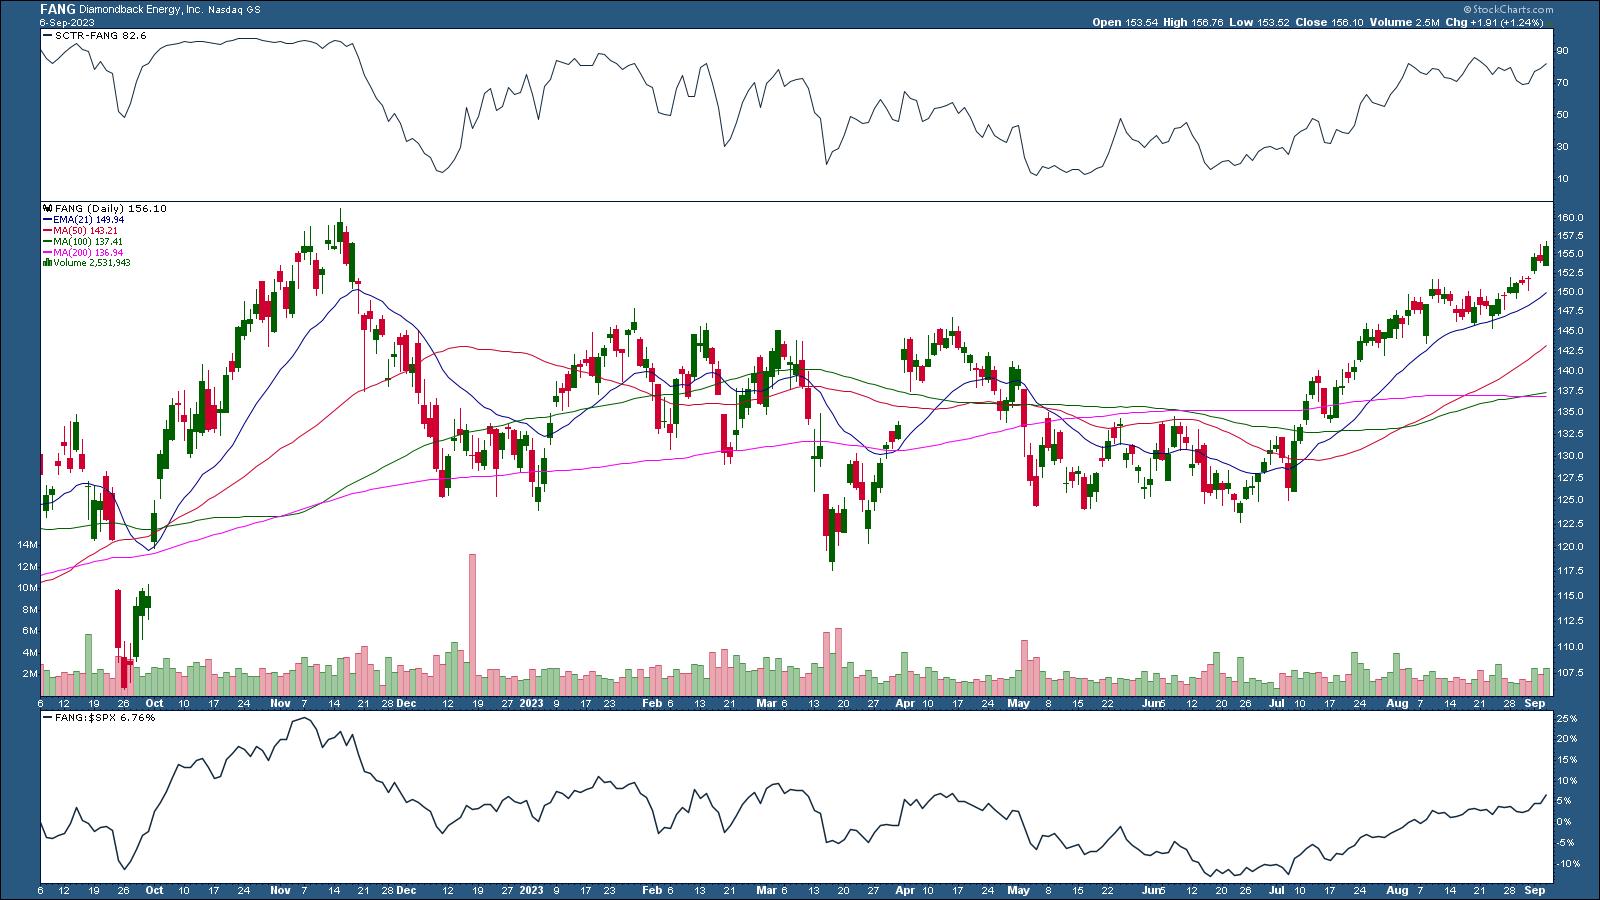
CHART 2: DIAMONDBACK ENERGY IS CORRELATED WITH OIL PRICES. The stock is in an uptrend, it has a high SCTR score, and its relative strength relative to the S&P 500 is increasing.Chart source: StockCharts.com (click on chart for live version). For educational purposes.
The stock has had a good run since mid-June. The stock has been trending higher, with higher highs and higher lows. It's been trending higher with the support of its 21-day exponential moving average. Its SCTR ranking has crossed above 70, and the stock's relative strength against the S&P 500 ($SPX) has been trending higher. It's in positive territory, which means Diamondback Energy is outperforming the S&P 500.
Overall, the stock looks like a potential long-term play. One concern is that the stock is relatively close to its all-time high. On the StockChartsACP platform, you can add the Distance To Highs indicator to see how far away price is from a specific high. In the chart below, FANG is 2.18% from its 52-week high.
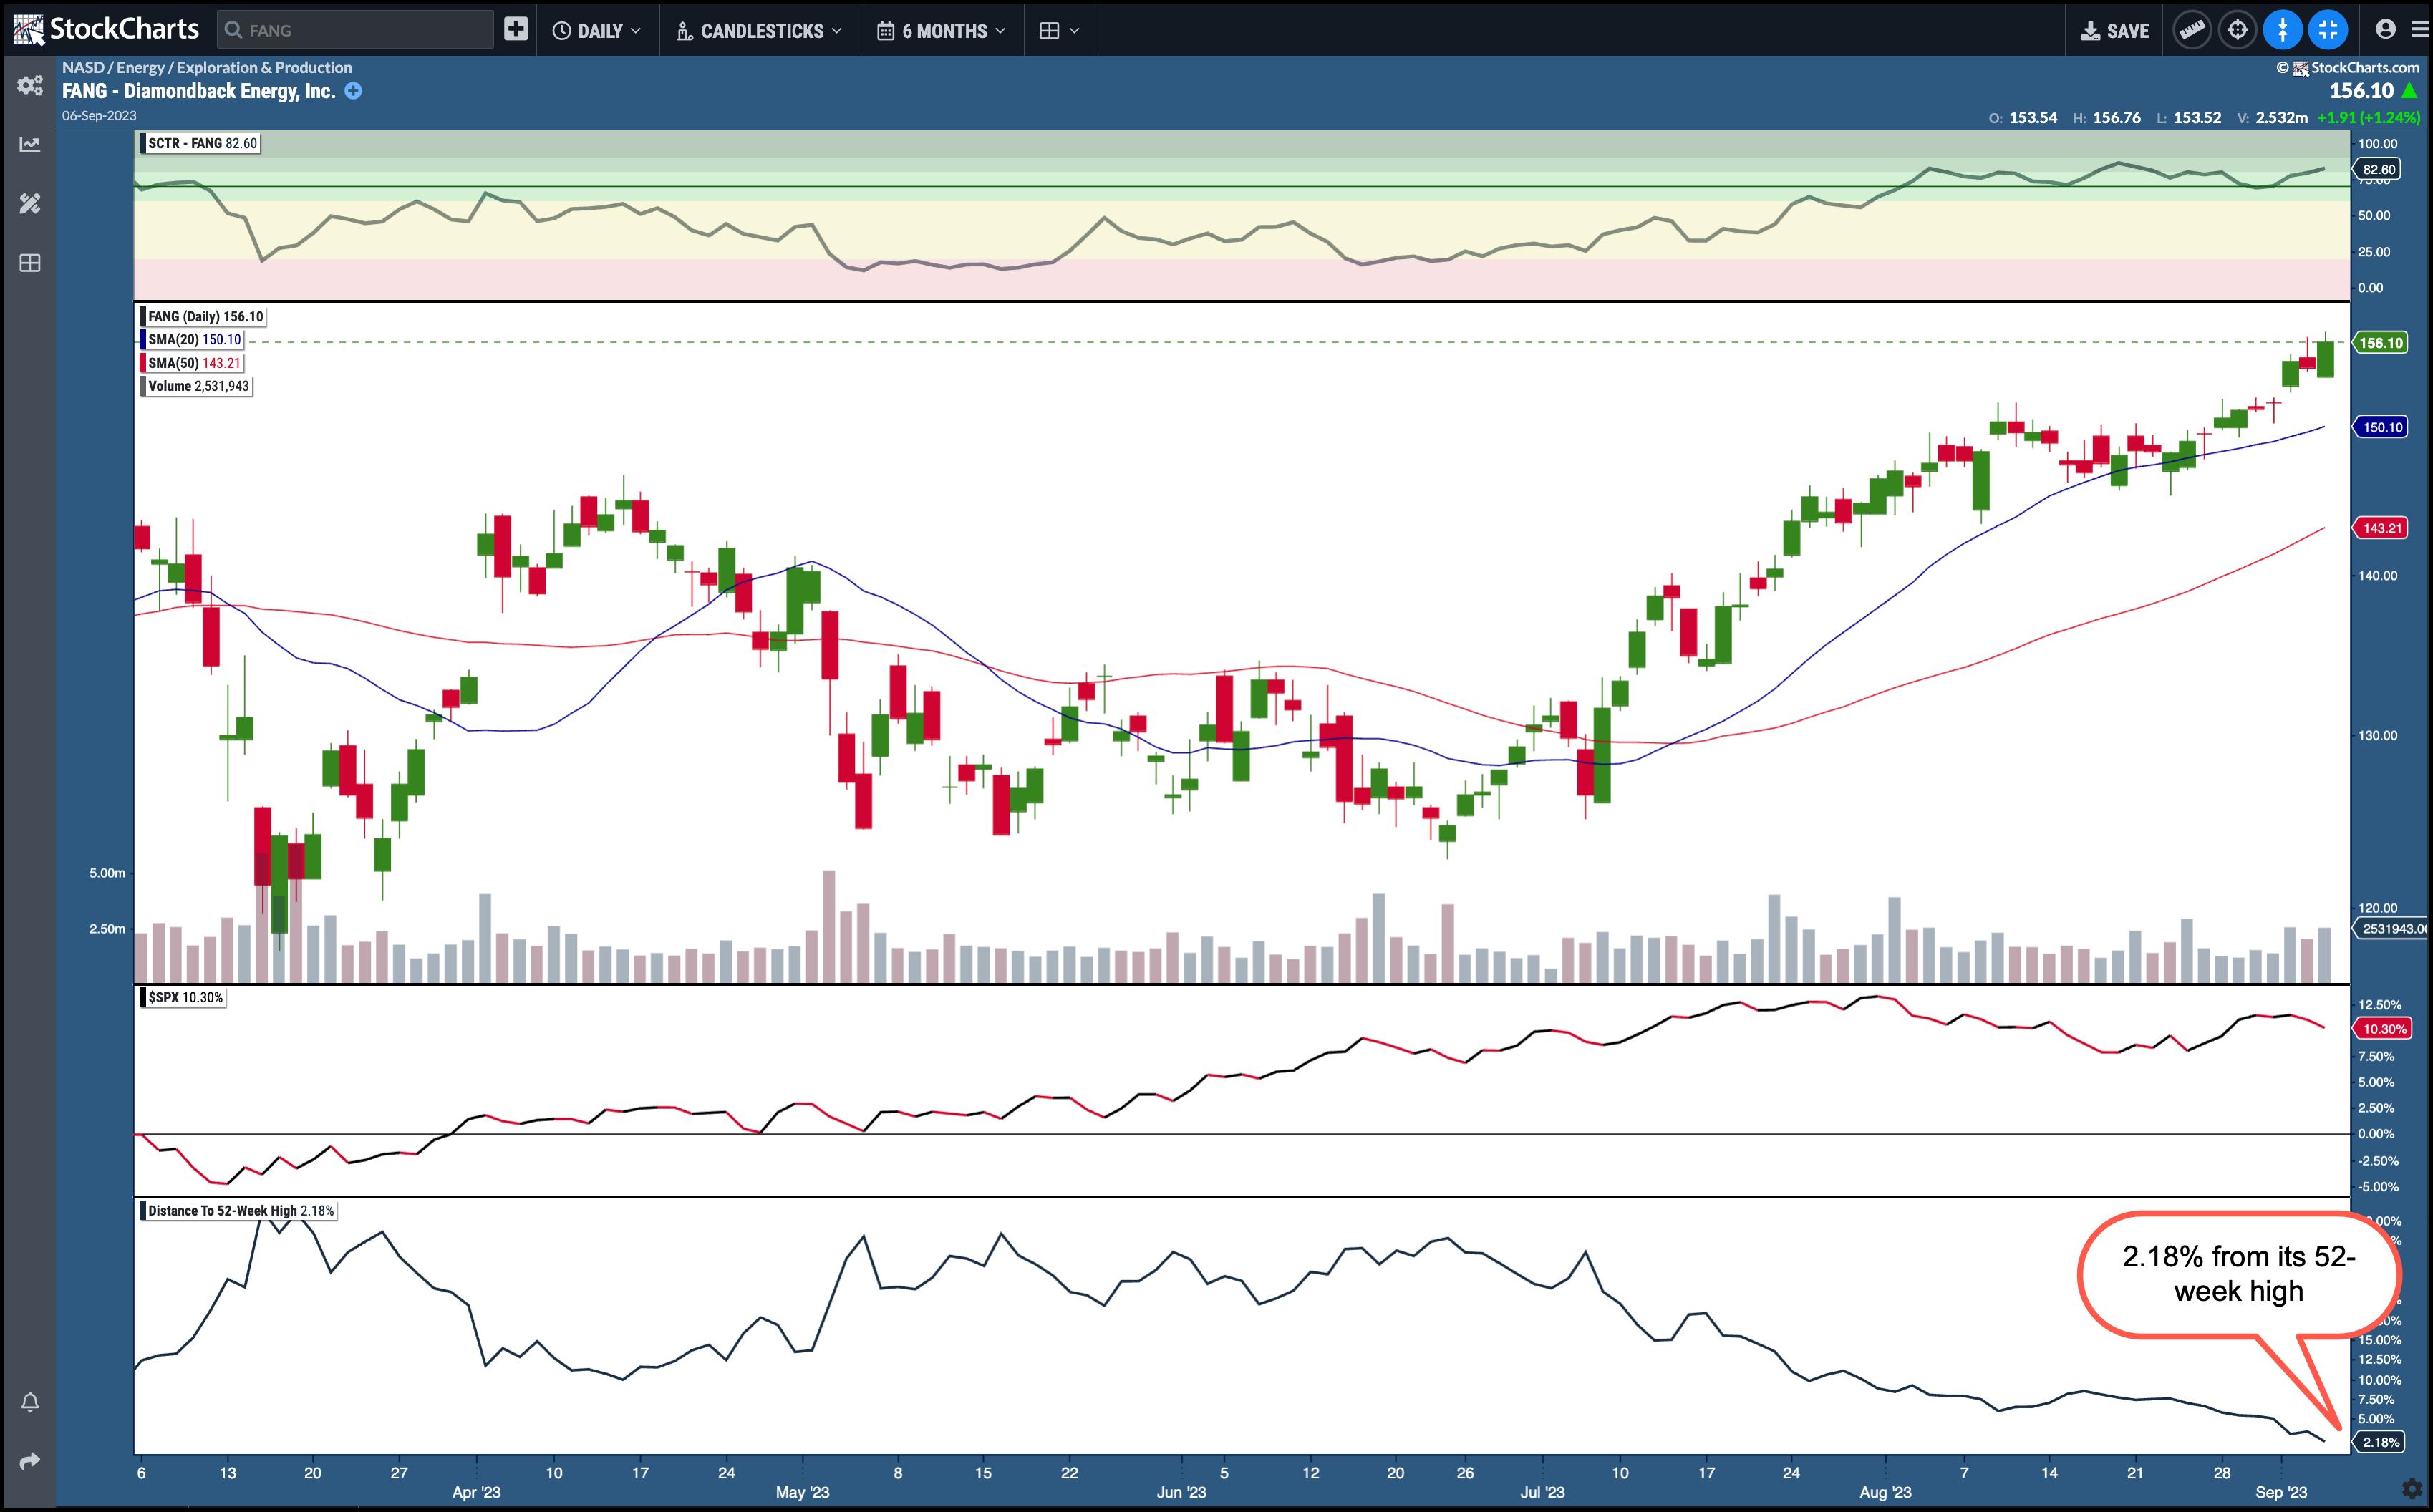
CHART 3: FANG IS GETTING CLOSE TO ITS 52-WEEK HIGH. The stock could pull back or continue moving higher. Chart source: StockChartsACP. For educational purposes.
What's a Good Entry Point?
One point of view is that if the stock price pulls back to its 21-day EMA and bounces off that level on strong volume, it could be a valid entry point. Another point of view is that the stock price could continue higher and reach its 52-week high. If that happens, it shows the strength of the stock, and the price could continue higher from there, reaching a new high.
Of course, price movement depends on the price of crude oil, so keep an eye on the macros if trading Diamondback or any other energy company. An added benefit to investing in energy stocks is the dividends.
How do you know if a stock is likely to pay dividends?
- Click on Symbol Summary page in StockCharts.com. You can access it from Your Dashboard > Member Tools or from Charts & Tools.
- Enter FANG in the symbol box.
- The Summary panel will display the dividend payout. Remember, dividends aren't guaranteed, but this gives you an idea of how much you could expect per share.
Final Thoughts
Whether you wait for a pullback and get in at a lower price or enter a trade as the stock trends higher, Diamondback Energy could be a stock worth owning.
SCTR Crossing Scan
[country is US] and [sma(20,volume) > 100000] and [[SCTR.us.etf x 76] or [SCTR.large x 76] or [SCTR.us.etf x 78] or [SCTR.large x 78] or [SCTR.us.etf x 80] or [SCTR.large x 80]]
Credit goes to Greg Schnell, CMT, MFTA.
Disclaimer: This blog is for educational purposes only and should not be construed as financial advice. The ideas and strategies should never be used without first assessing your own personal and financial situation, or without consulting a financial professional.
Happy charting!


