TAKEAWAYS
- AI will need networks to support its development and growth and one stock that can benefit in this space is Arista Networks
- The stock is trading above its 50-day moving average and hit a new 52-week high
- The stock is outperforming the S&P 500 index and its RSI is strengthening

When the market goes up one day and down the next, it becomes challenging to jump into a stock. It's best to exercise patience until the market shows direction. But that doesn't mean you should keep your eyes off the stock market, as it's an excellent time to set up your ChartLists so you can jump into stocks when the time is right.
One stock not to ignore is Arista Networks (ANET). It may not be one of the AI stocks that makes it to the headlines, but if AI is the next big wave in technology, the infrastructure will play a massive role in its development. ANET is a big player in this space. The company reported earnings on Monday after the close; earnings and revenues beat estimates, and the stock received a bullish call from a Morgan Stanley analyst. That was enough of a catalyst for Arista Networks' stock price—it gapped up at the open and is now trading at a new 52-week high.
Is Arista Networks Toppy?
Whenever a stock sees a price spike, especially when it's trading at its all-time high, the general thinking is that the stock has already hit the top and it's too late to get in. Well, that could be true, but looking at a longer-term view of Arista Networks' stock price, it's been in a pretty steady, shallow uptrend. Looking at past price action, whenever the stock price hit a high, it stalled, pulled back, and continued its uptrend. A similar scenario could occur again.
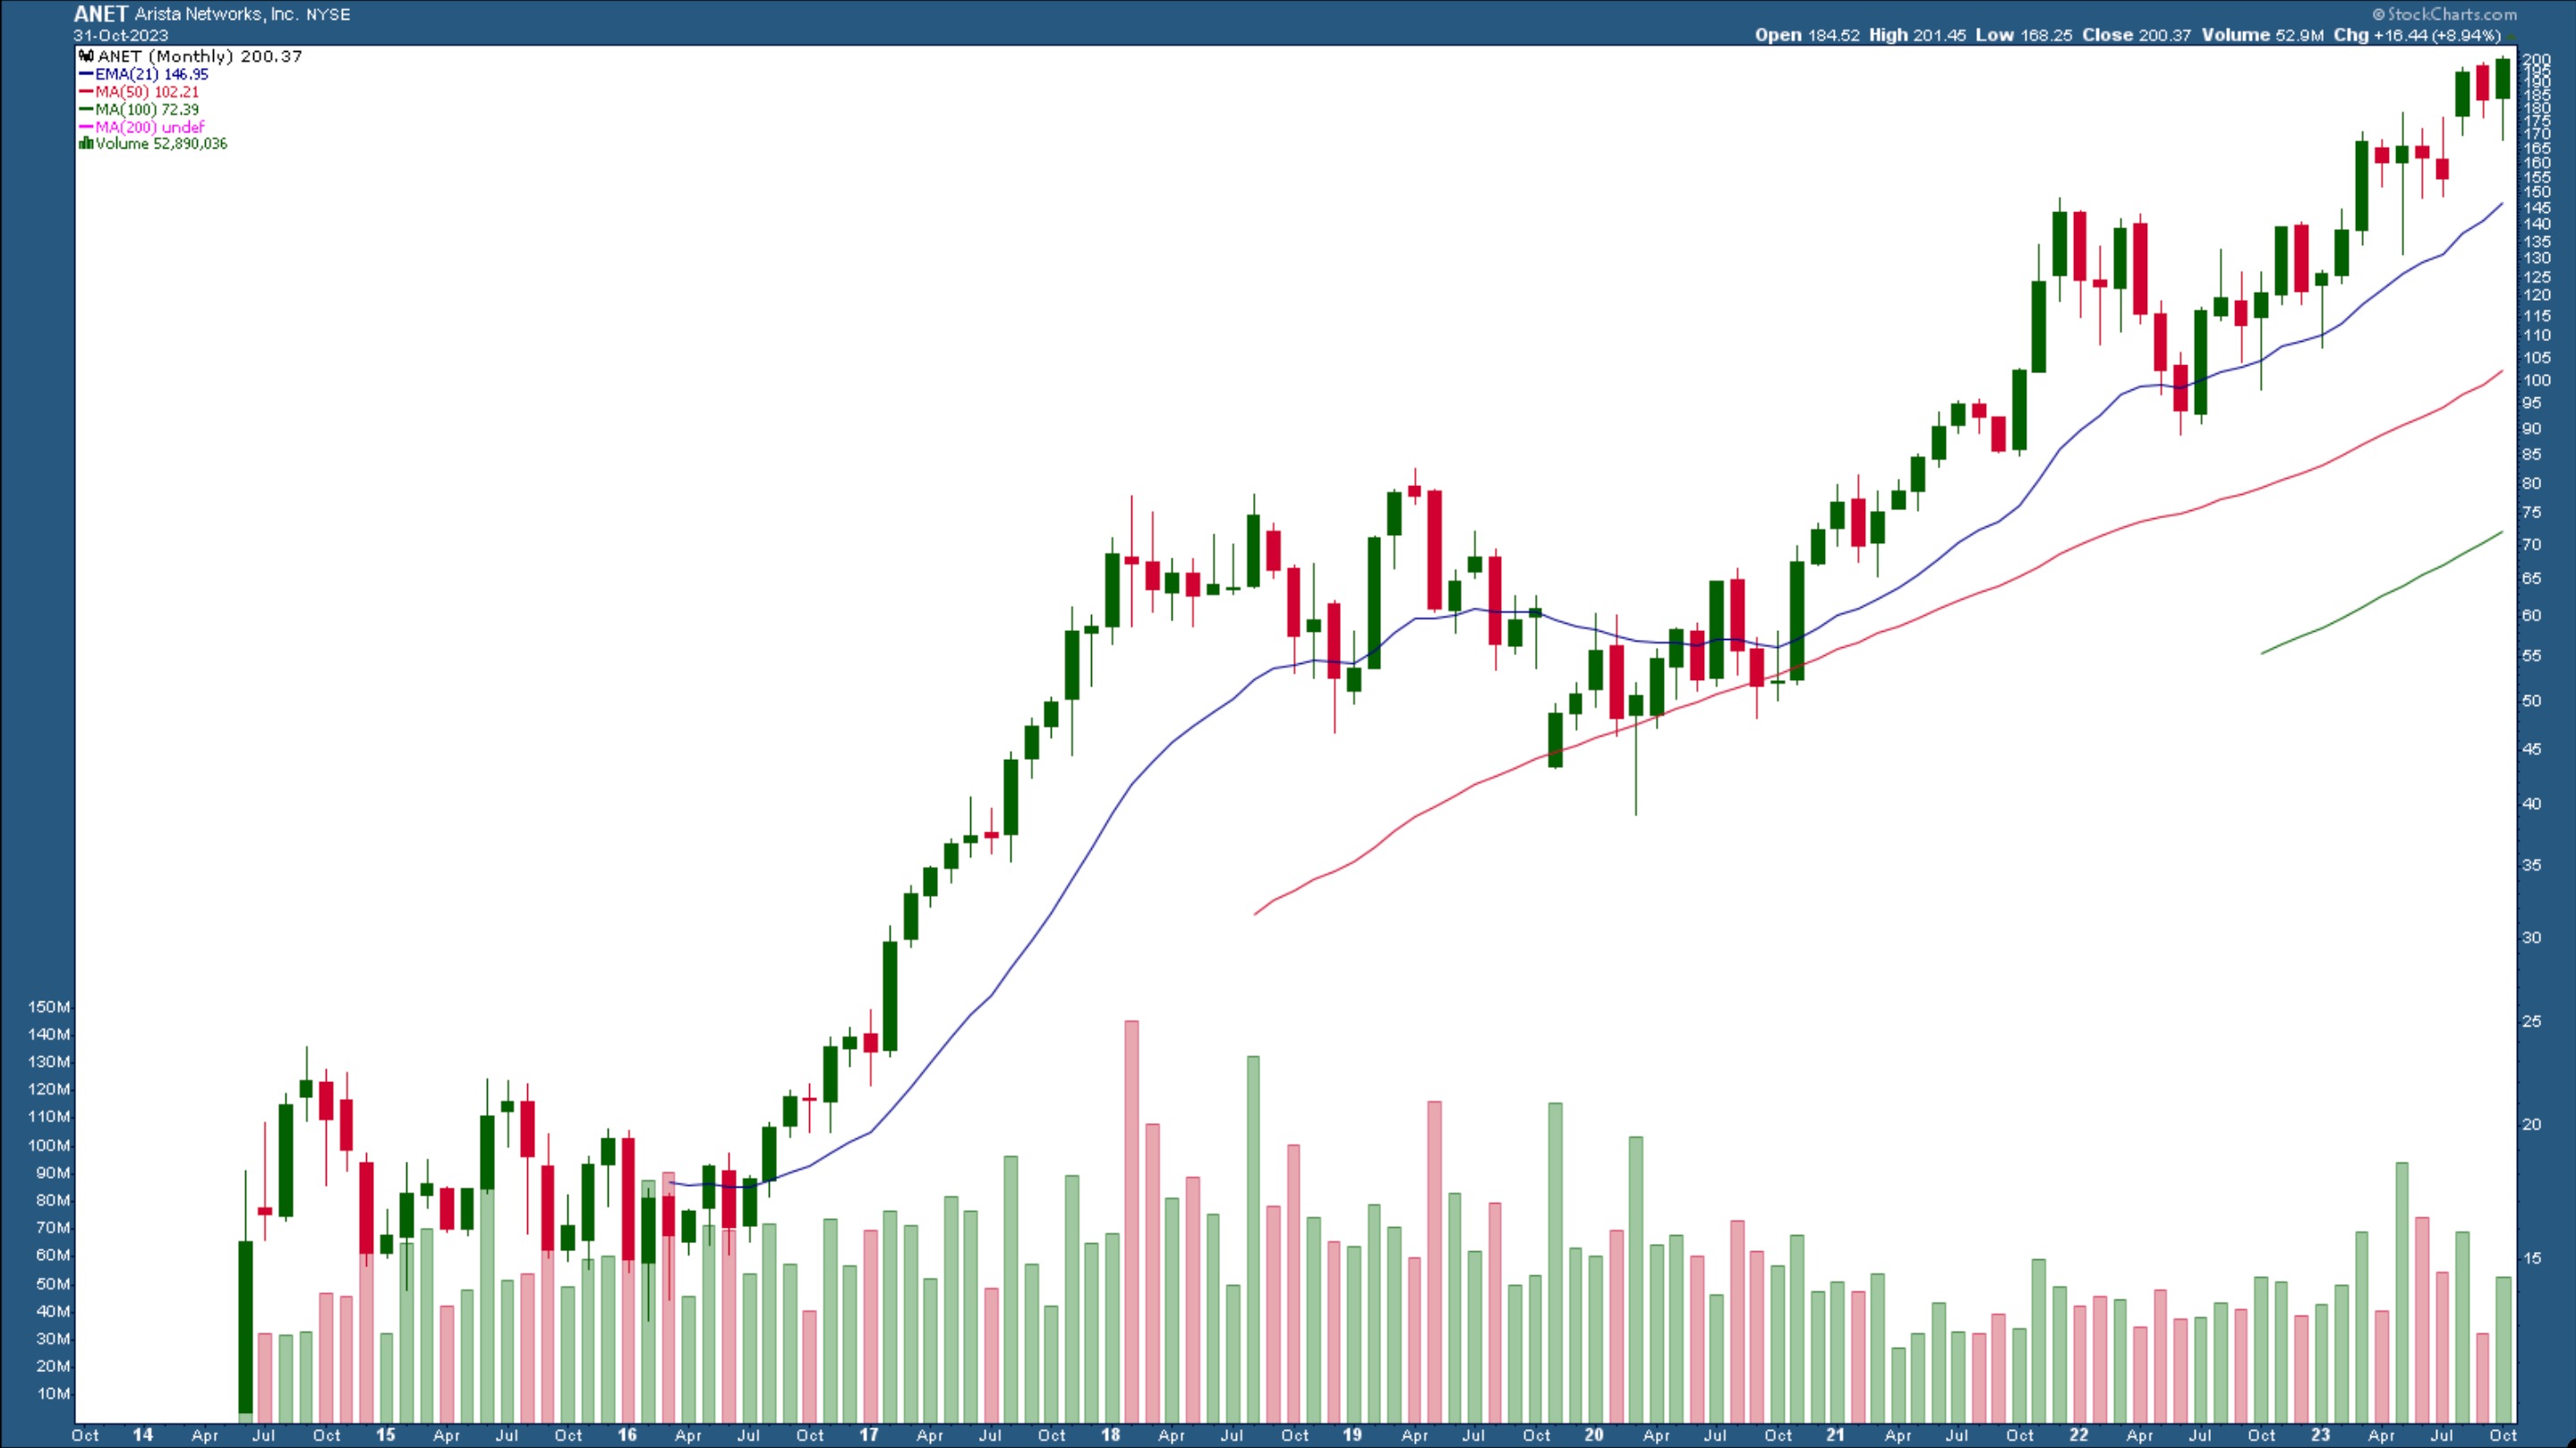
CHART 1: MONTHLY CHART OF ARISTA NETWORKS (ANET). The stock is trading at its all-time high. Does it have room to rise further?Chart source: StockCharts.com. For educational purposes.
The weekly chart shows a similar picture. ANET is hitting against its all-time high. Will it bust through it or pull back for a few weeks and start making its next leg up?
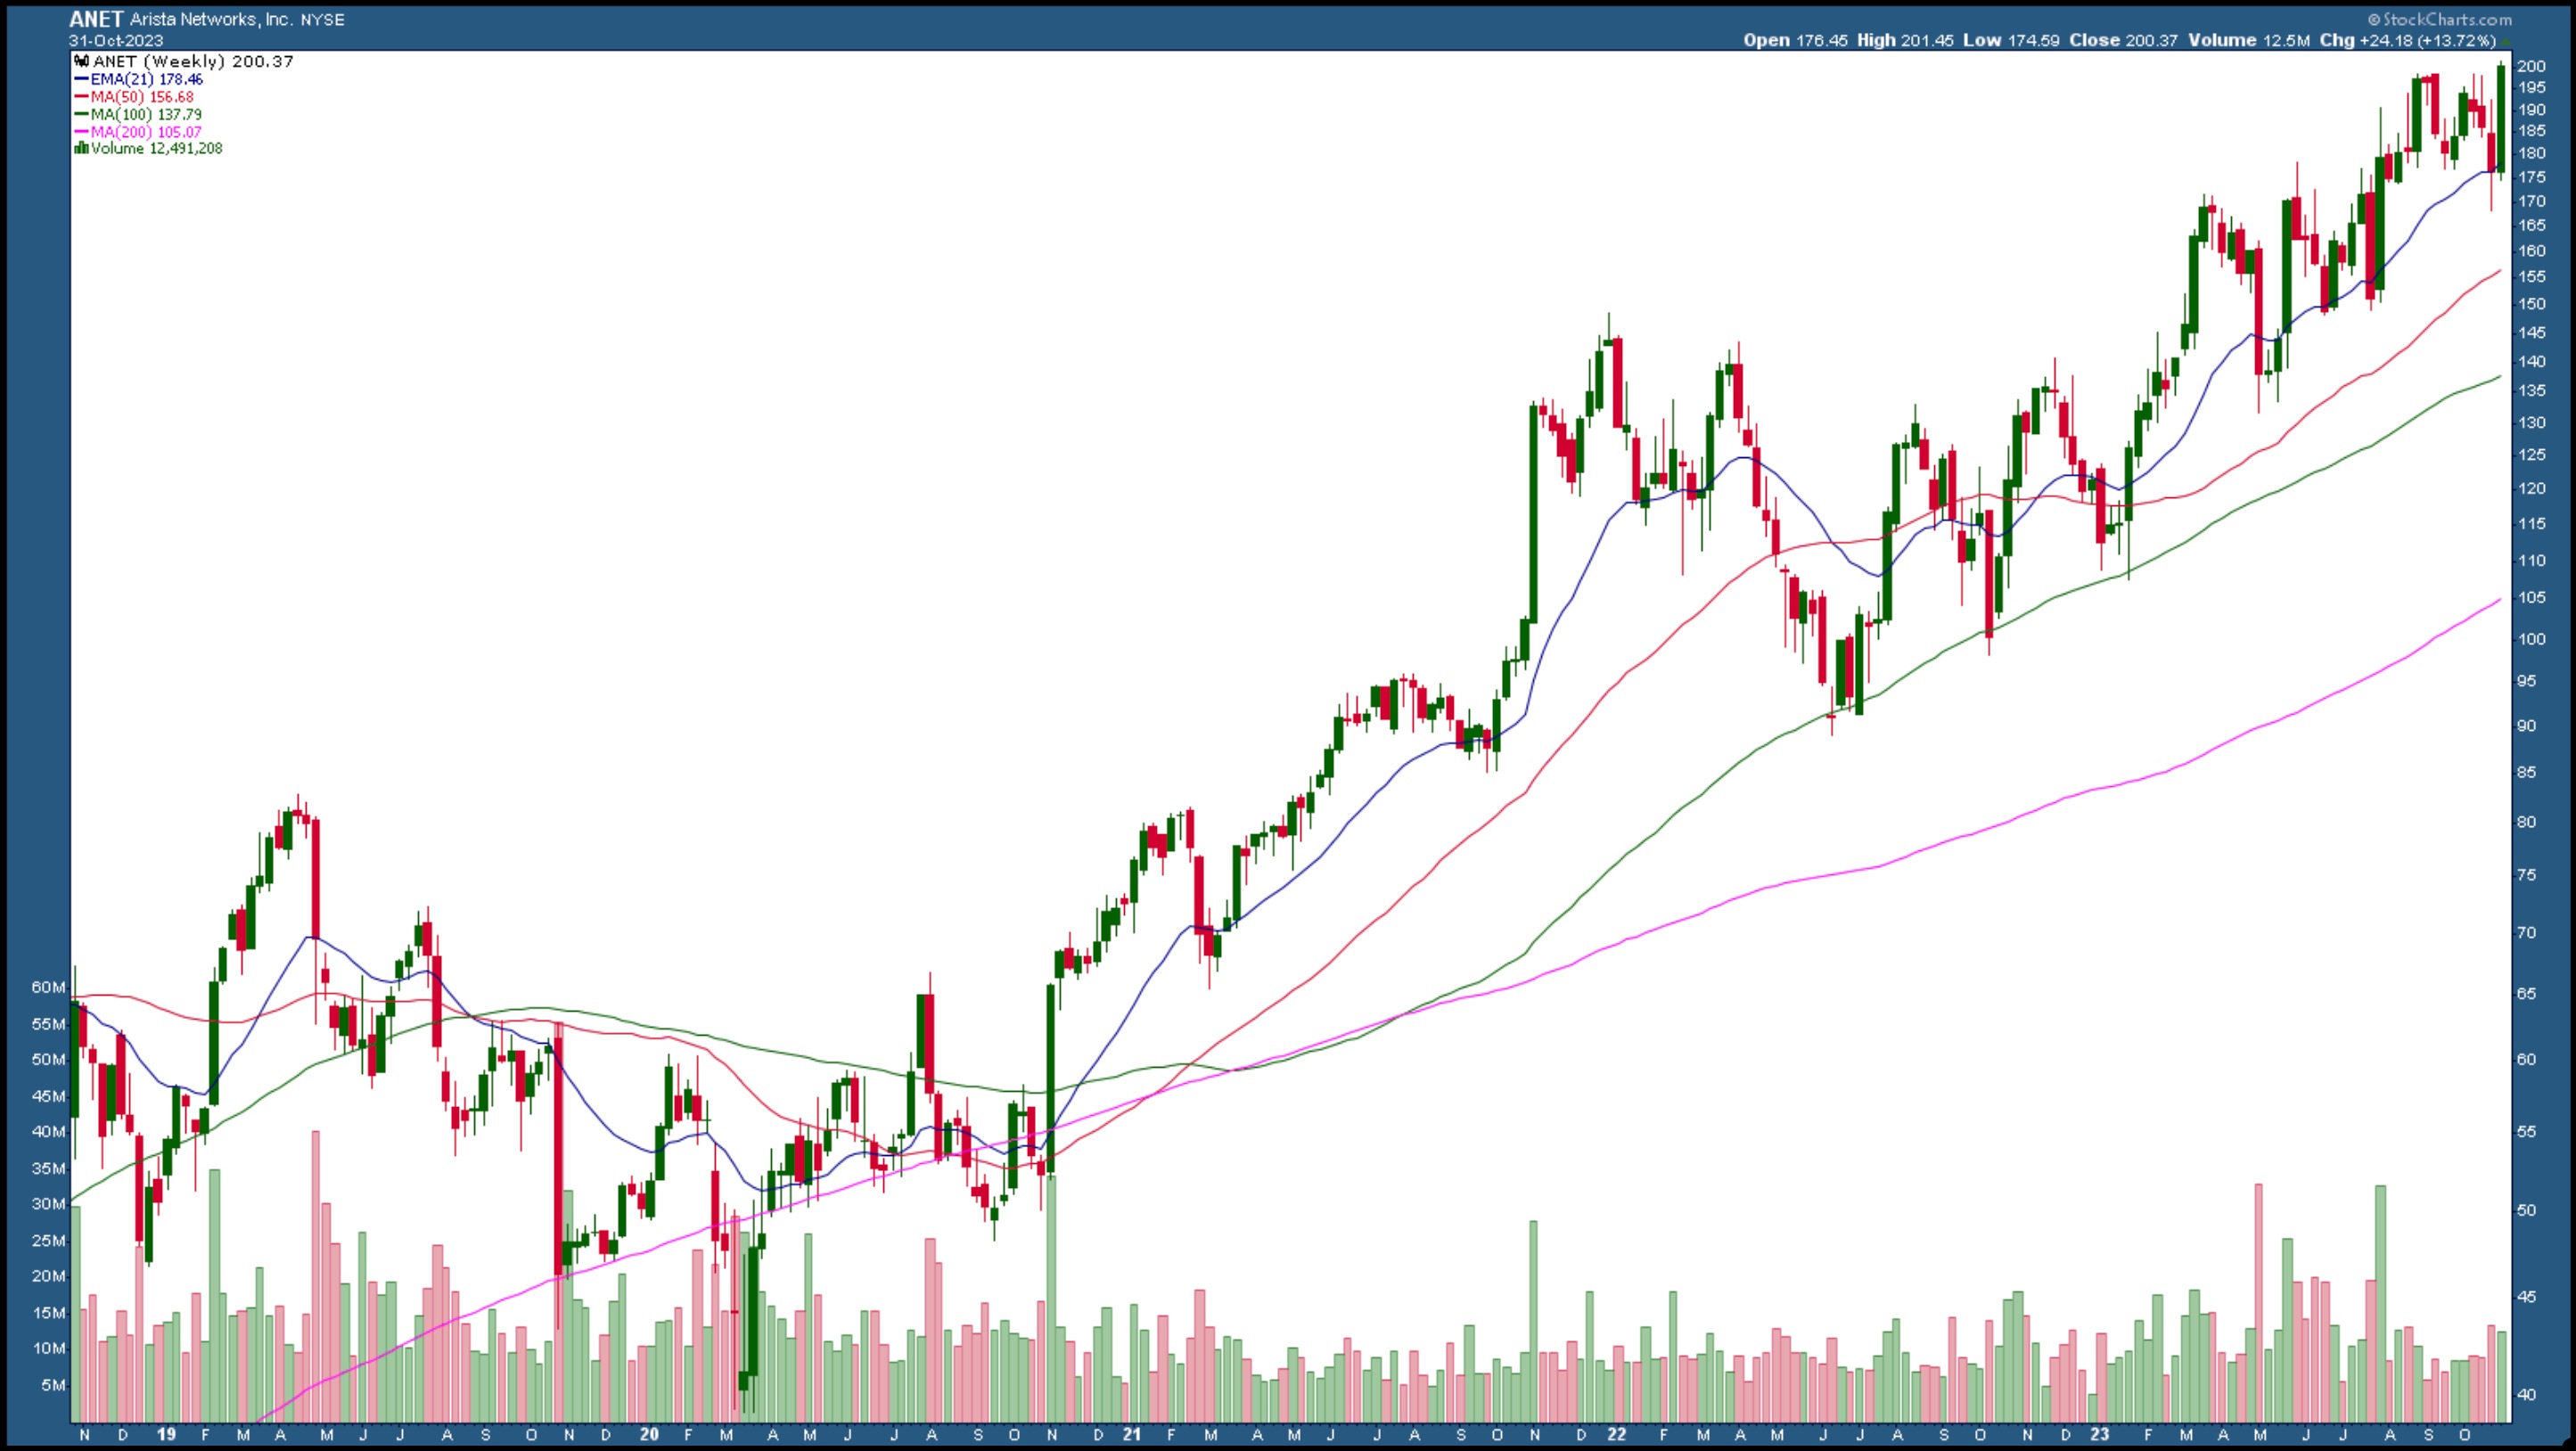
CHART 2: WEEKLY CHART OF ARISTA NETWORKS. The stock is trading above its 21-day EMA (blue line) and closed at a new high. Chart source: StockCharts.com. For educational purposes.
The daily chart shows that price gapped up on positive news, pulled back to its 50-day simple moving average (SMA) support level, and then moved higher. This suggests that the buyers were dominating and keeping the stock price higher.
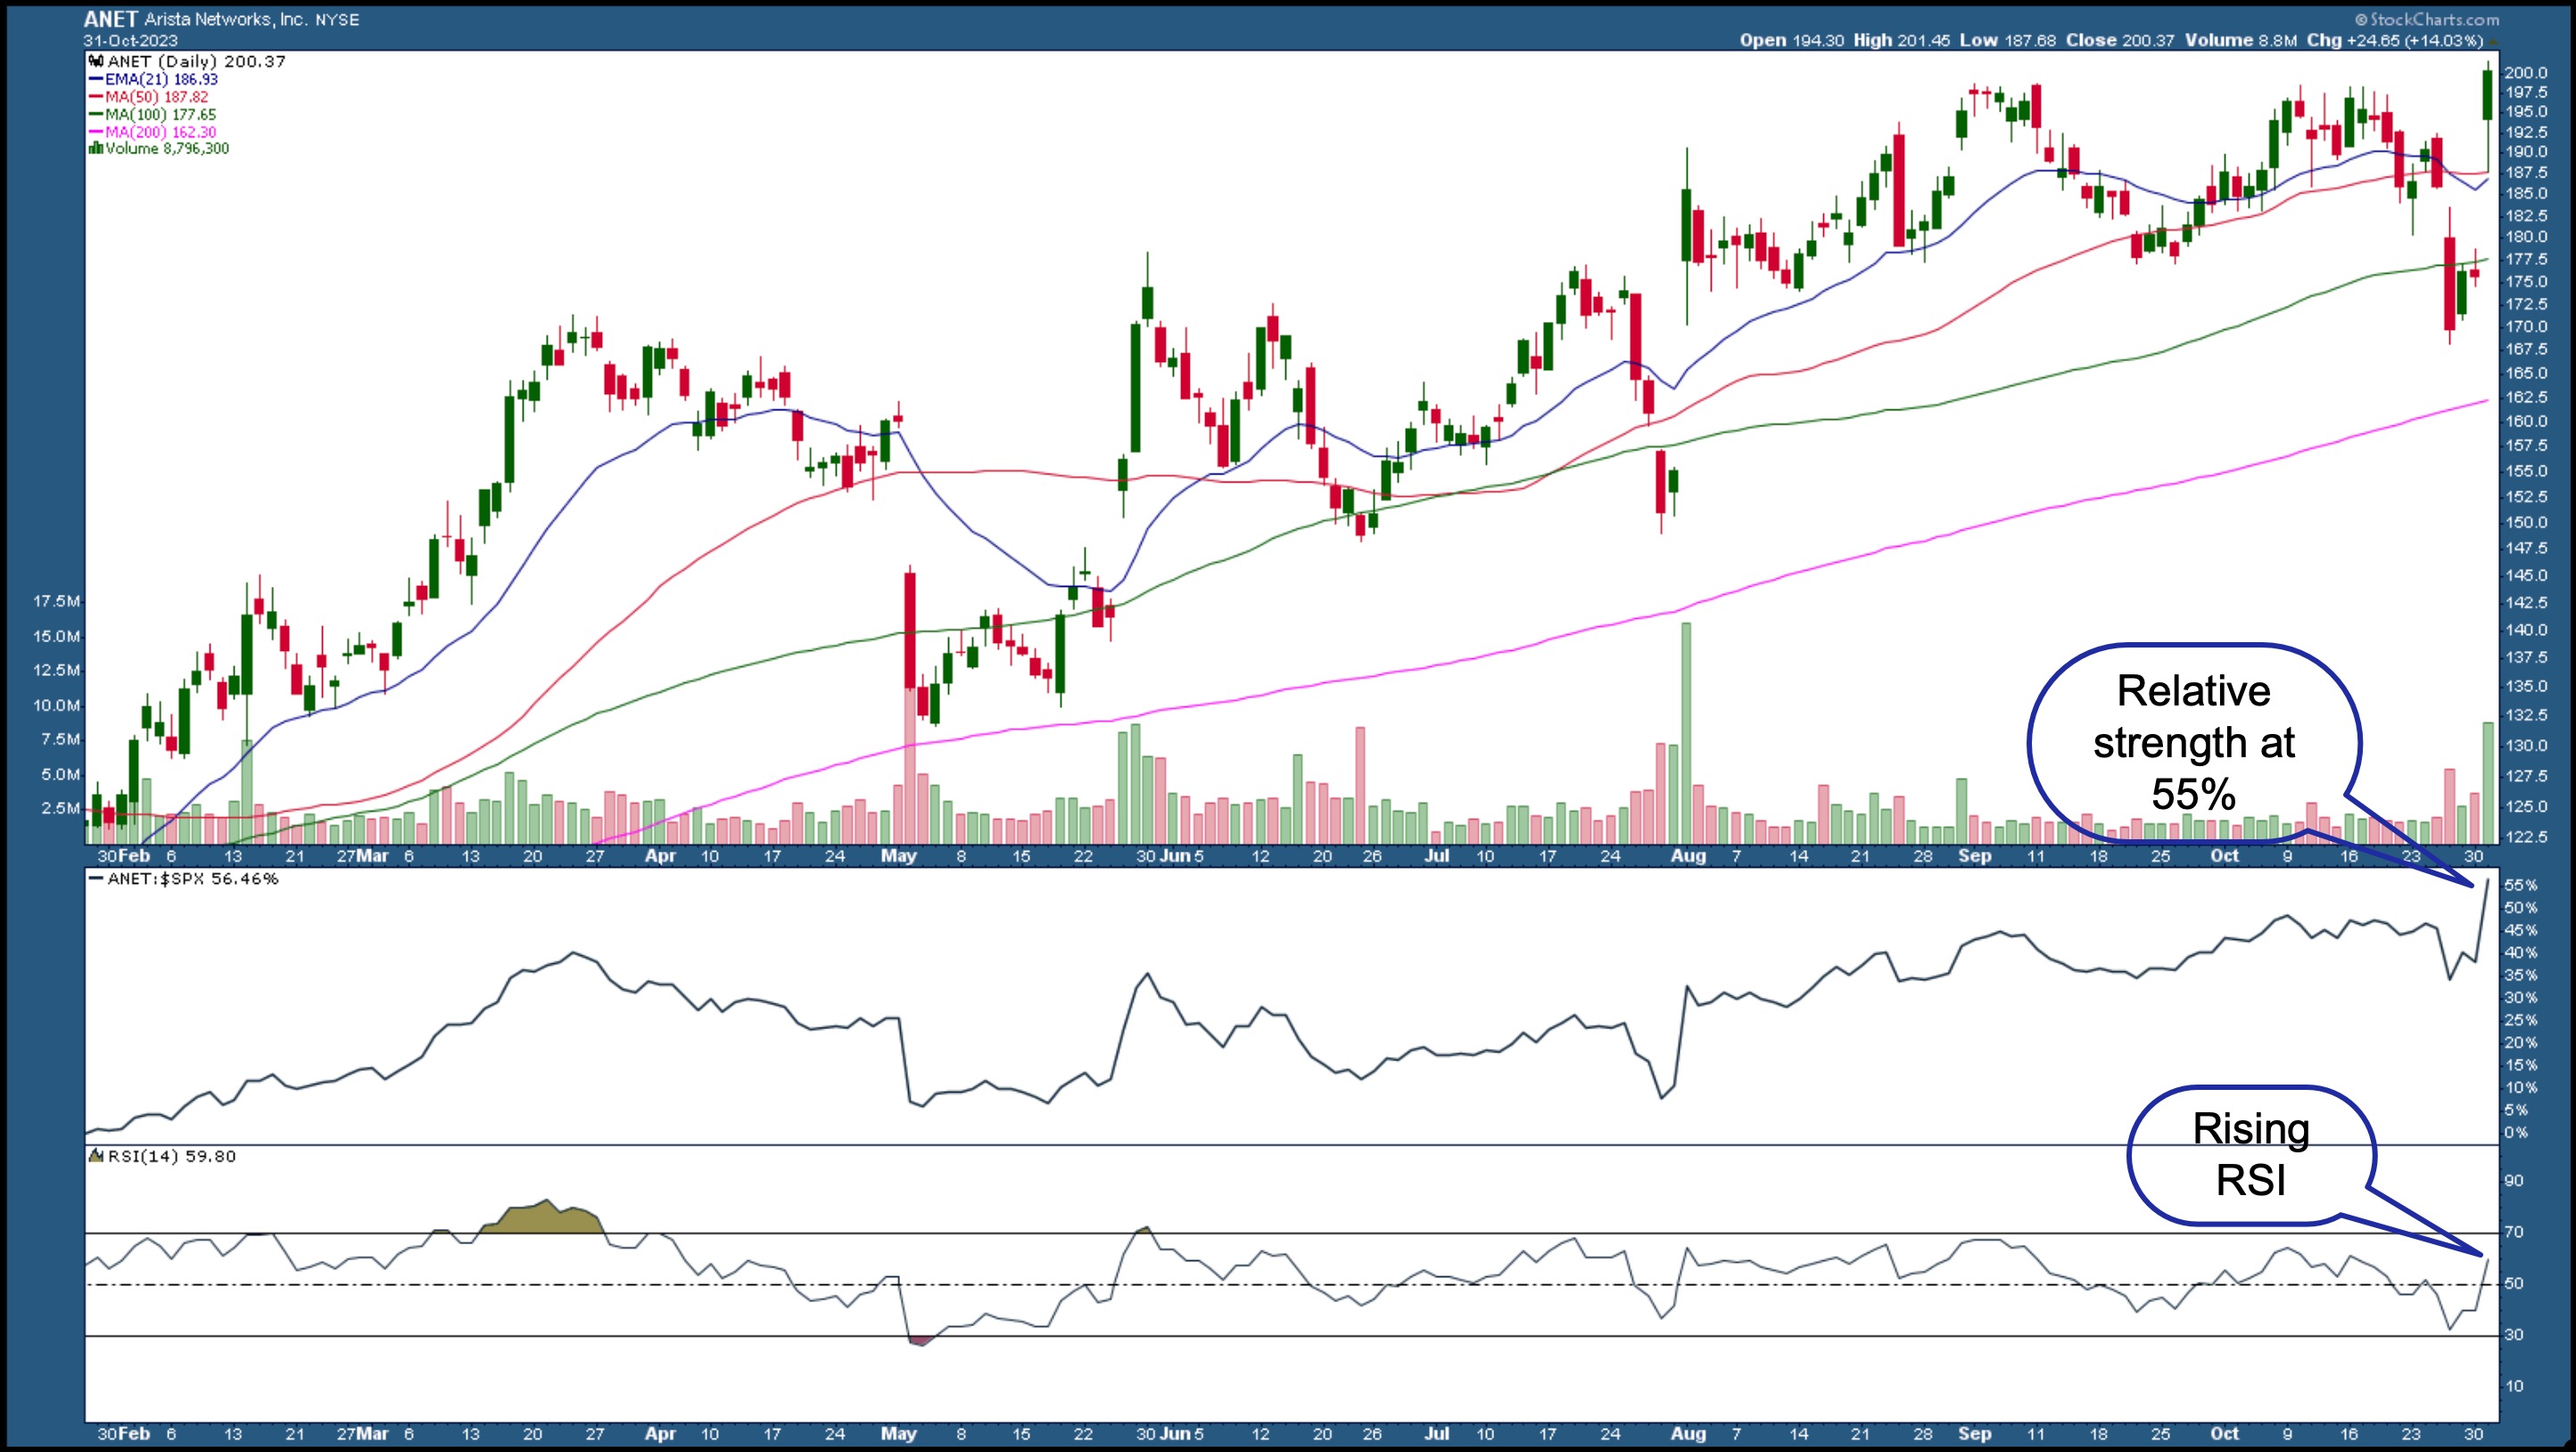
CHART 3: DAILY CHART OF ARISTA NETWORKS. The stock bounced off its 50-day simple moving average, is outperforming the S&P 500, and its relative strength index (RSI) is rising. Chart source: StockCharts.com. For educational purposes.
Relative to the S&P 500 index ($SPX), ANET's price performance is at 55%, which means the stock is outperforming the index. The relative strength index (RSI) is also encouraging; it's between 50 and 70, which means there is room for an upside move in the stock's price. During its last earnings report on July 31, ANET's stock price displayed a similar scenario. Price gapped lower, but after the earnings report, the stock price gapped up on strong volume, then moved sideways. It gently trended higher until right before the most recent earnings report, when it repeated a similar action.
The Pattern Could Repeat
If Arista Networks' stock price pulls back and continues its uptrend, it could be a longer-term hold. Keep an eye on its relative strength, the RSI, and how the price moves relative to its moving averages. This stock is definitely one to add to your StockCharts ChartLists.

Disclaimer: This blog is for educational purposes only and should not be construed as financial advice. The ideas and strategies should never be used without first assessing your own personal and financial situation, or without consulting a financial professional.
Happy charting!


