TAKEAWAYS
- AMD stock price hits a new 52-week high and moves above its upper Bollinger Band®
- AMD's share value could continue rising or pull back and go below the middle Bollinger Band
- Watch volume, relative strength index, and money flow index to identify a slowing down in buying pressure

Advanced Micro Devices, Inc. (stock symbol: AMD) is one stock that met several positive trading criteria during Wednesday's trading. The stock price hit a new 52-week high and moved above its upper Bollinger Band®, its upper price channel, and so on.
The AMD chart below displays a Bollinger Band overlay and the Distance From 52-Week High indicator in the lower panel (available in StockChartsACP).
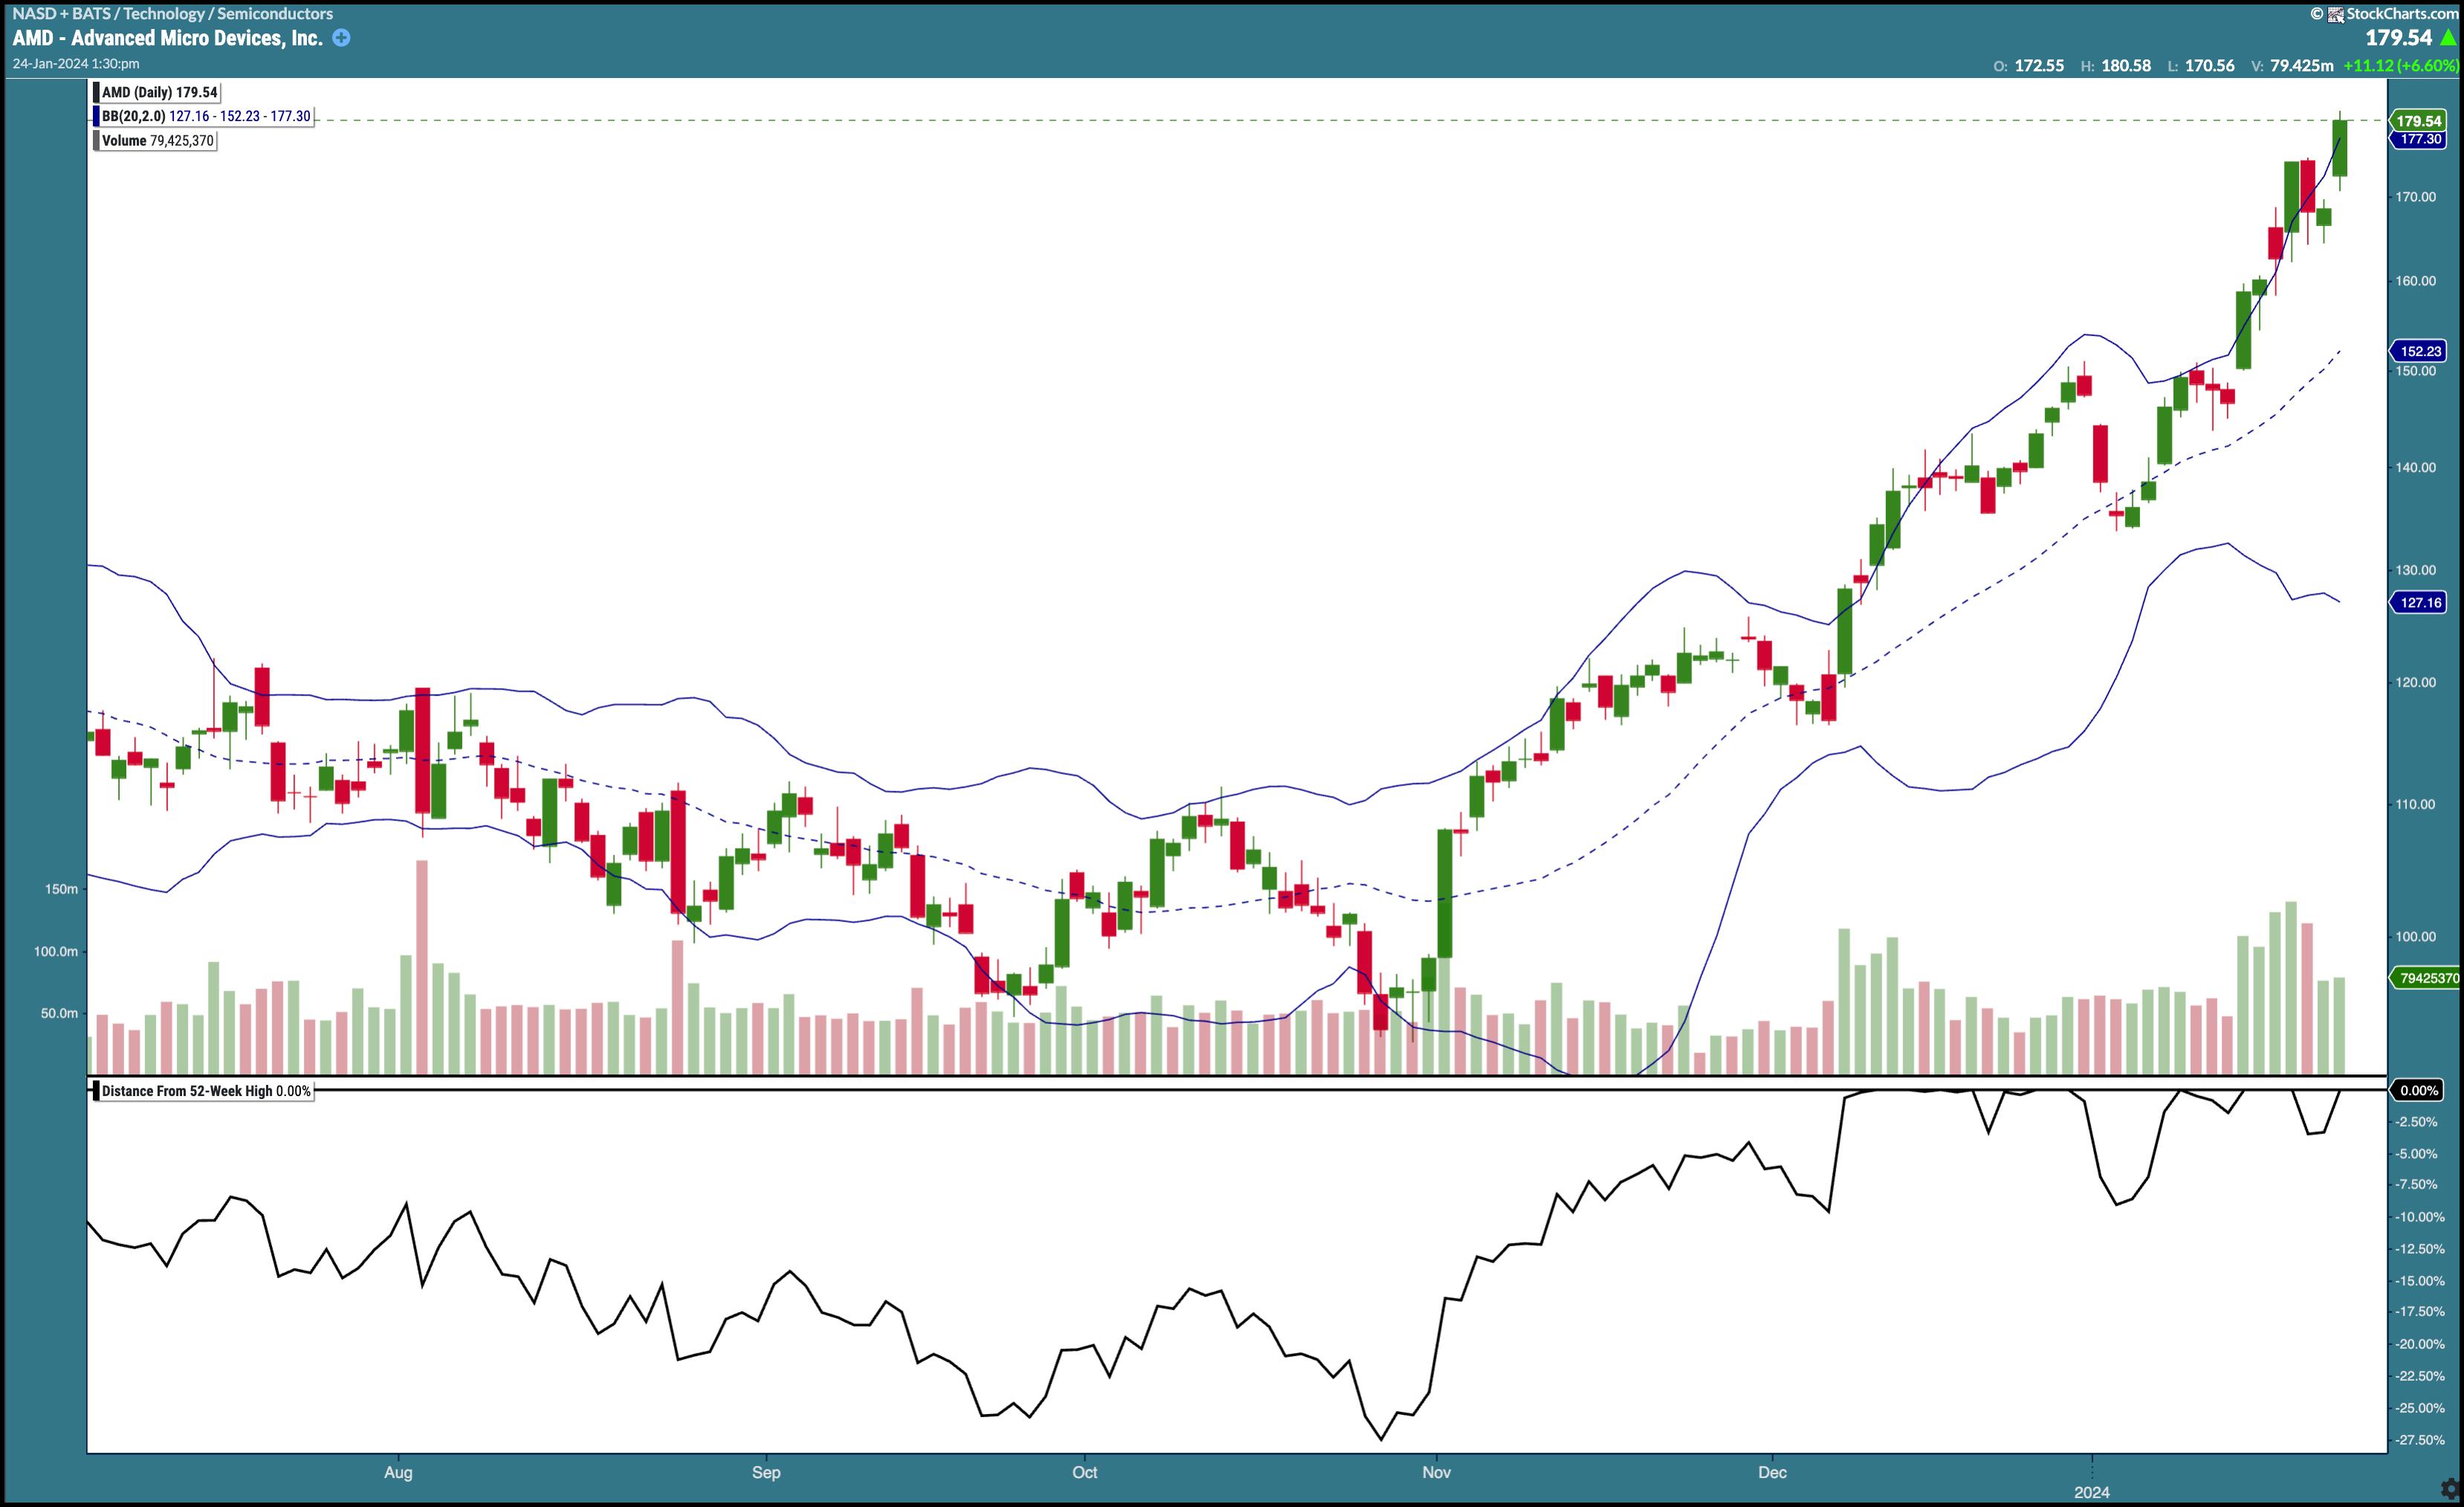
CHART 1. AMD STOCK RISES TO NEW 52-WEEK HIGH. The stock price has moved above its upper Bollinger Band and has hit a new 52-week high. How much higher can the stock move?Chart source: StockChartsACP. For educational purposes.
Scanning the Stock Universe
Identifying stocks and exchange-traded funds (ETFs) to invest or trade can be difficult. But, with a little effort, you can develop a method that gives you an acceptable return more often than not.
The good news is that the learning curve isn't steep. All you need to do is follow these steps:
- Create a few different scan criteria.
- Regularly run the scans.
- Analyze the filtered stocks or ETFs.
- Make your entry and exit decisions.
The StockCharts Scan Engine can help you filter out stocks and ETFs that meet specific criteria. There are several predefined scans which are great to start from, but, once you become familiar with the scans, you can tweak them or come up with one compatible with your investment objectives.
For example, when the broader market indexes are hitting new highs, you may want to run the New All-Time Highs, New 52-Week Highs, or any of the scans in the New Highs category.
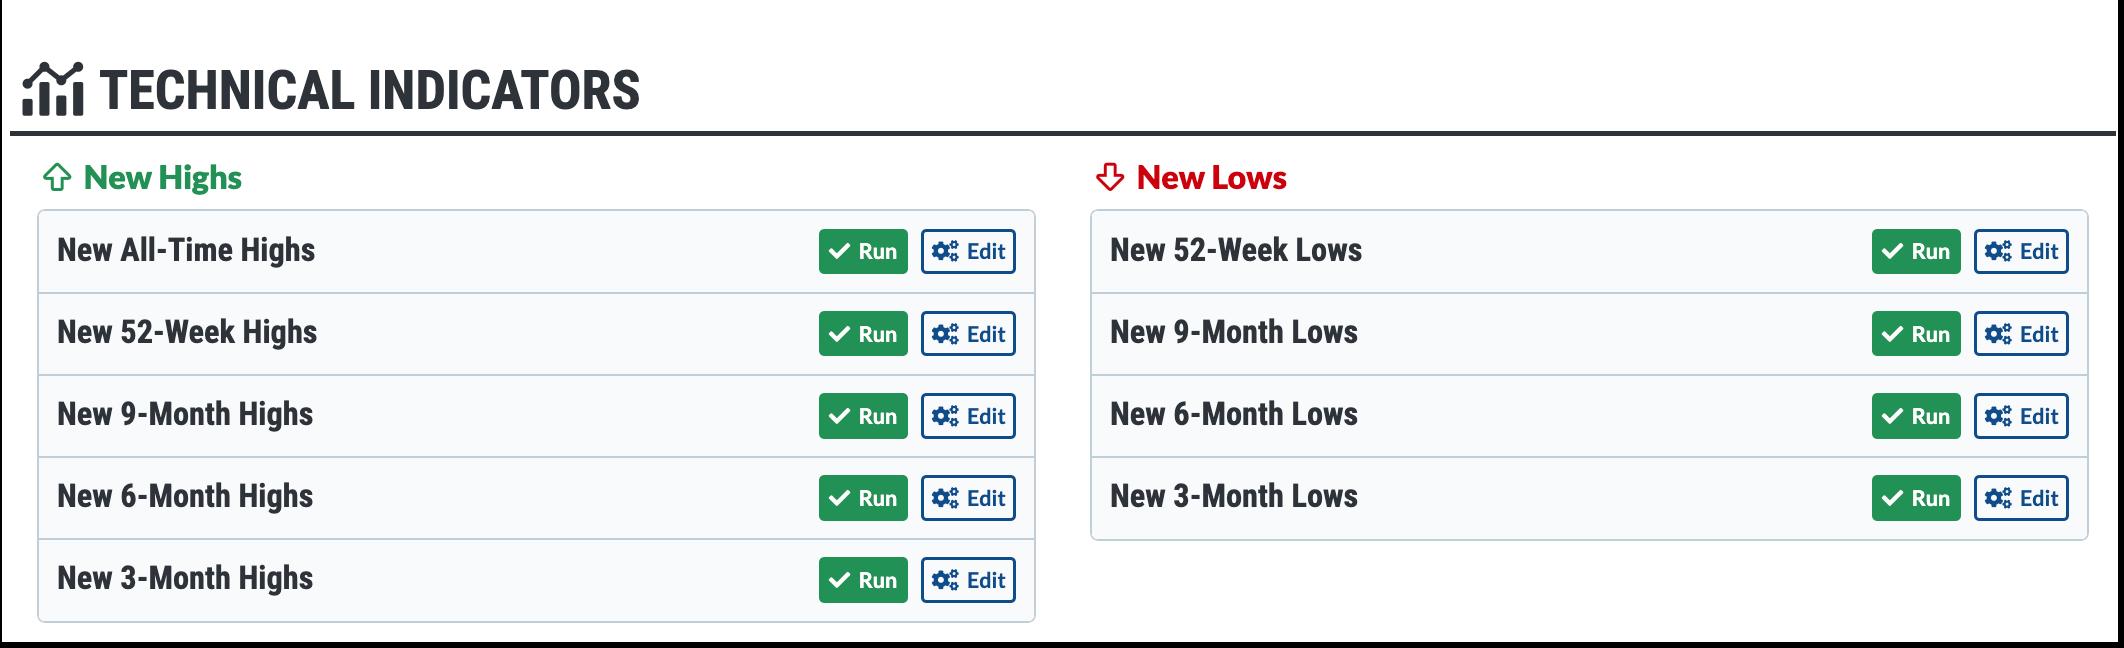
CHART 2. THE STOCKCHARTS SCAN ENGINE. There are several predefined scans to choose from. Here, you can see the New Highs and New Lows scans.Chart source: StockCharts.com. For educational purposes.
Scanning can do more than identify stocks or ETFs to trade. Seeing how many stocks and ETFs were filtered gives you an idea of the stock market's breadth. If a relatively large number of stocks are hitting significant highs when the market is hitting new highs, it further confirms the bullish rally. If a few stocks are hitting highs when the market is moving higher, it suggests that the buying pressure is drying up.
Another point to remember is that a stock getting filtered out on a scan doesn't mean you should blindly buy the stock. You still need to do your due diligence. Let's look closely at AMD stock and determine if it's worth the investment and where to set your price targets.
AMD Keeps On Advancing
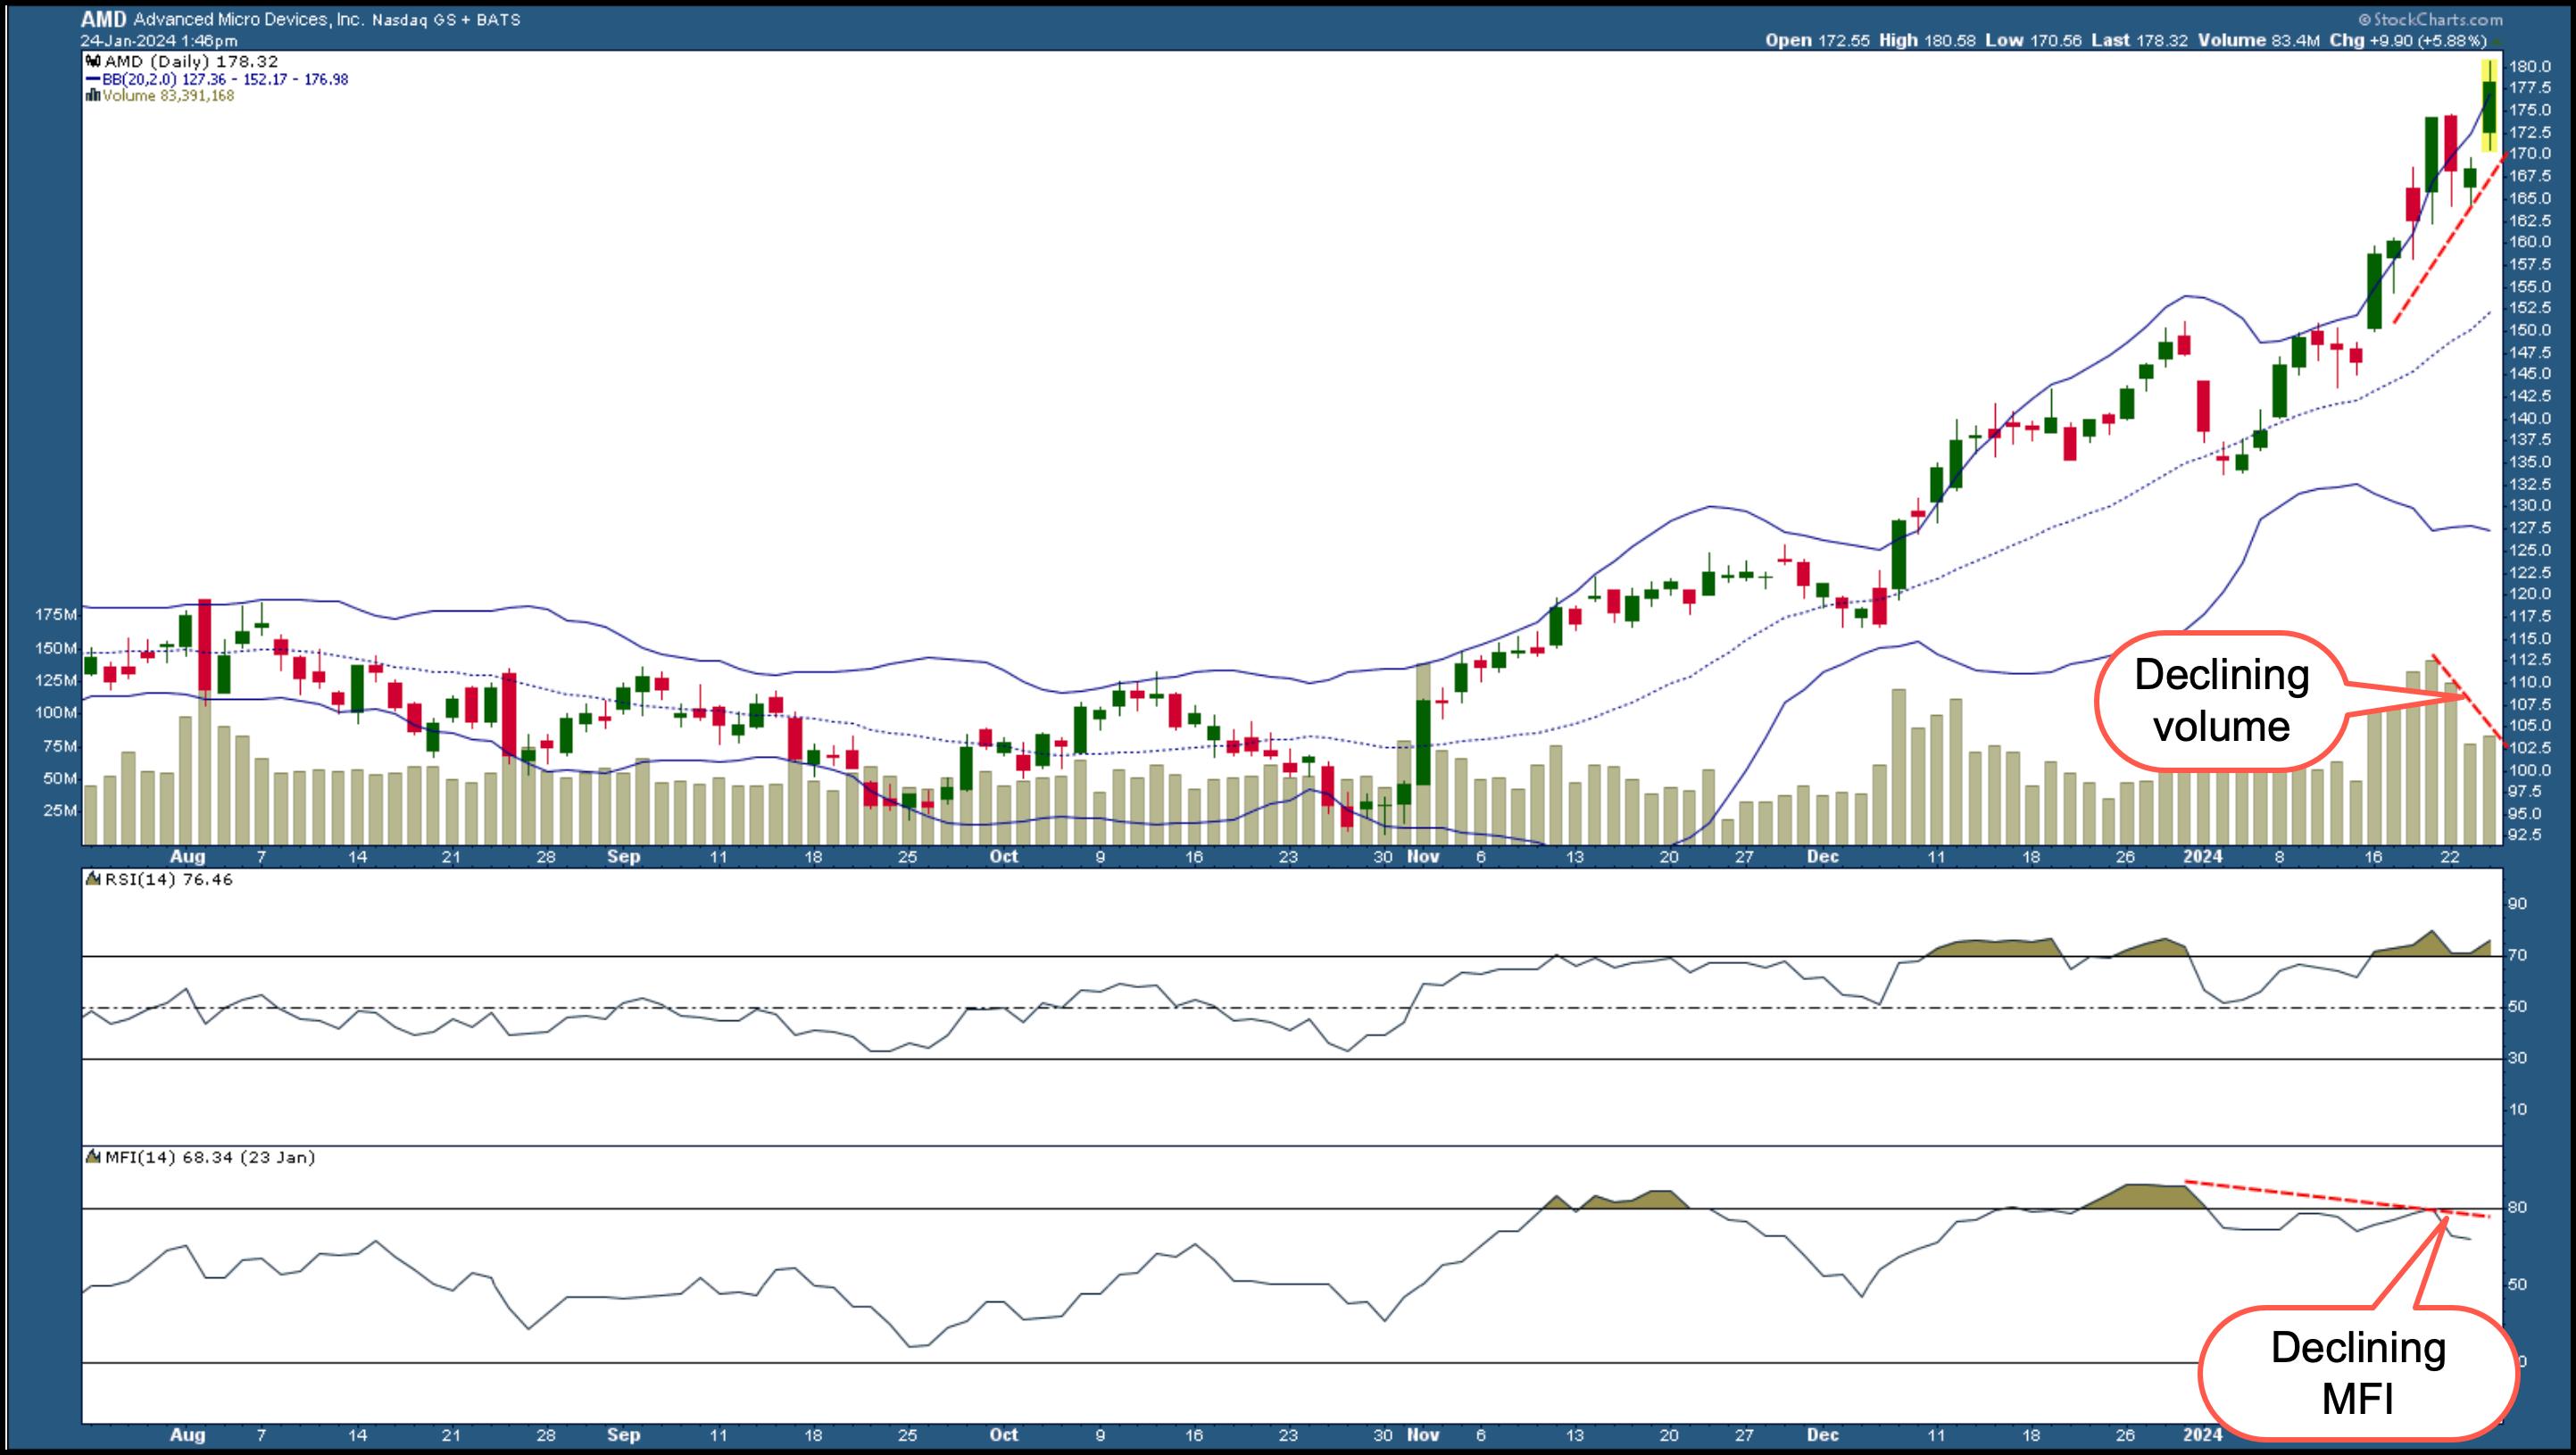
CHART 3. AMD STOCK RALLIES HIGHER BUT FOR HOW LONG? Keep an eye on volume, relative strength index, and money flow index to identify a buying slowdown. A divergence between price and money flow could indicate an upcoming pullback.Chart source: StockCharts.com. For educational purposes.
Since November, AMD stock's share value has been moving higher. Looking closely at the AMD price chart above, you'll see the following price action.
On November 1, the stock price had a wide range day with a spike in volume. Note how the stock performed with respect to the Bollinger Bands.

- AMD stock went close to the upper band, pulled back in December, and reversed and broke above the upper band.
- The stock price walked along the upper band for a while, traded sideways for a few days, and again attempted to reach the upper band.
- It didn't quite make it and pulled back and fell below the middle band.
- On January 6, AMD stock moved above the middle band and touched the upper band before pulling back slightly.
- On January 17, the stock broke above the upper Bollinger Band and continued trending higher, for the most part.
When is a good time to add AMD to your portfolio? When a stock reaches a new high, it's natural to think it may be too late to get in. But remember, stocks don't move higher in a straight line. They pull back, and those pullbacks can present an entry opportunity.
You need to exercise patience if you want to improve your financial well-being.
Looking at the chart of AMD, there were a few times during the uptrend when AMD's stock price pulled back to the middle Bollinger band and reversed. There's a chance it could happen again, but maybe not in the next few days. This is where you need to tame the fear of missing out (FOMO). You need to exercise patience if you want to improve your financial well-being.
It also helps to add some indicators to your chart. In our AMD chart, you can see volume overlaid on the price, the relative strength index (RSI), and the money flow index (MFI). Volume is declining as AMD's share value continues to rise.
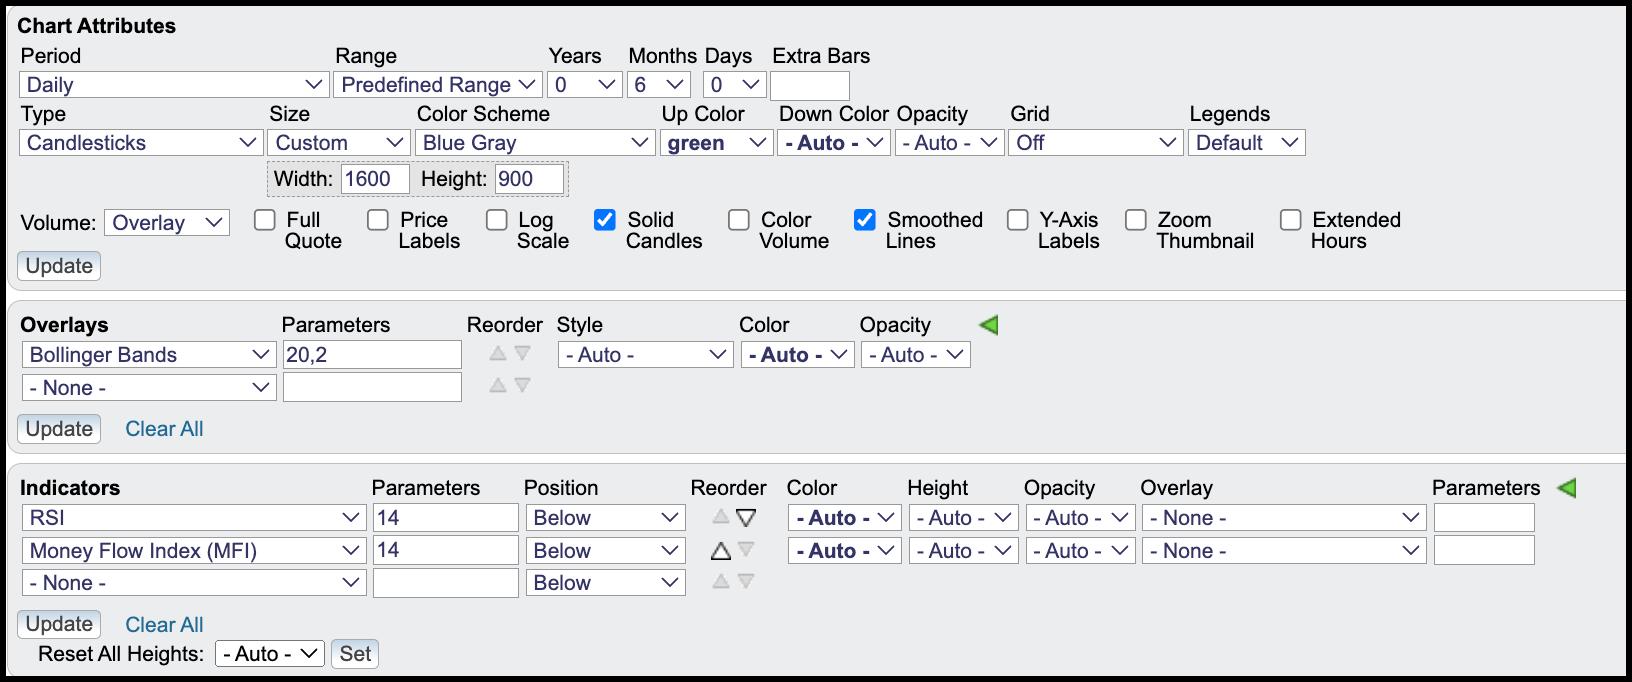
How To Recreate the Chart Using SharpCharts
- Enter AMD in the symbol box.
- Select Overlay from the Volume dropdown menu.
- Select Bollinger Bands under Overlays.
- Select RSI and Money Flow Index (MFI) in the Indicators section.
It's also important to note that the RSI is above 70, which puts AMD in overbought territory. The RSI could stay overbought for an extended period, especially if the stock continues to trend higher.
When you turn your attention to the MFI, it's clear that the money flowing into the stock is declining. This divergence between price and indicator could signal a bearish move ahead.
Setting Your Price Targets
First, add AMD to one of your ChartLists (and if you're not sure how to create one, check out this link) and review the chart regularly. When you see the stock price sell-off, watch the middle band. If the stock price breaks below the middle band and reverses, check the volume, RSI, and MFI.
- If the reversal has momentum, i.e. increasing volume, MFI, and RSI, a good entry point would be just above the middle band.
- An ideal exit target would be just above the upper band.
- If the stock falls below the middle band and overall market conditions weaken, you may want to revisit the stock later. Monitoring AMD's chart doesn't hurt because it could make a comeback.
The bottom line: Don't ignore AMD's stock chart.
Disclaimer: This blog is for educational purposes only and should not be construed as financial advice. The ideas and strategies should never be used without first assessing your own personal and financial situation, or without consulting a financial professional.
Happy charting!


