TAKEAWAYS
- Crude, Brent, gasoline, and natural gas tend to dip and peak in the summer months
- Although seasonality plays are attractive, they're not always reliable
- If you're looking to take advantage of seasonality trends, here are some technical levels to watch

We're heading deeper into the summer months, which usually means higher demand for energy products, namely crude oil and gas. While demand tends to be seasonal, the entire crude complex is also sensitive to changes in macroeconomic and geopolitical environments.
In short, all traders and investors understand that it's not a viable strategy to "go long" in energy commodities every June in anticipation of price increases. Still, the seasonal context is worth looking at and comparing to both the current price situation and fundamental forecasts.
What Are Analysts Saying?
Crude oil prices continue to rise, marking its best performance since April, following a three-week streak of declines. Analysts expect summer fuel demand to draw down inventories and tighten the market, with oil stockpiles projected to decrease by 850,000 barrels per day in the third quarter.
Despite mixed economic data from China and US consumer sentiment prompting analysts to forecast weakness in energy demand, the oil market still looks like it will tighten deeper into the summer months.
What Does Seasonality for the Crude Complex Look Like Relative to the S&P 500?
Summer doldrums in the broader stock market may exhibit seasonal consistency, but are not predictable. The same can be said for increasing energy demand. Still, let's take a look at the crude complex over the last 10 years using StockCharts' Seasonality charts.
Note: We're comparing seasonal performance against the S&P 500 because it's the benchmark against which you may adjust your portfolio.
WTI Crude Oil (USO as proxy)
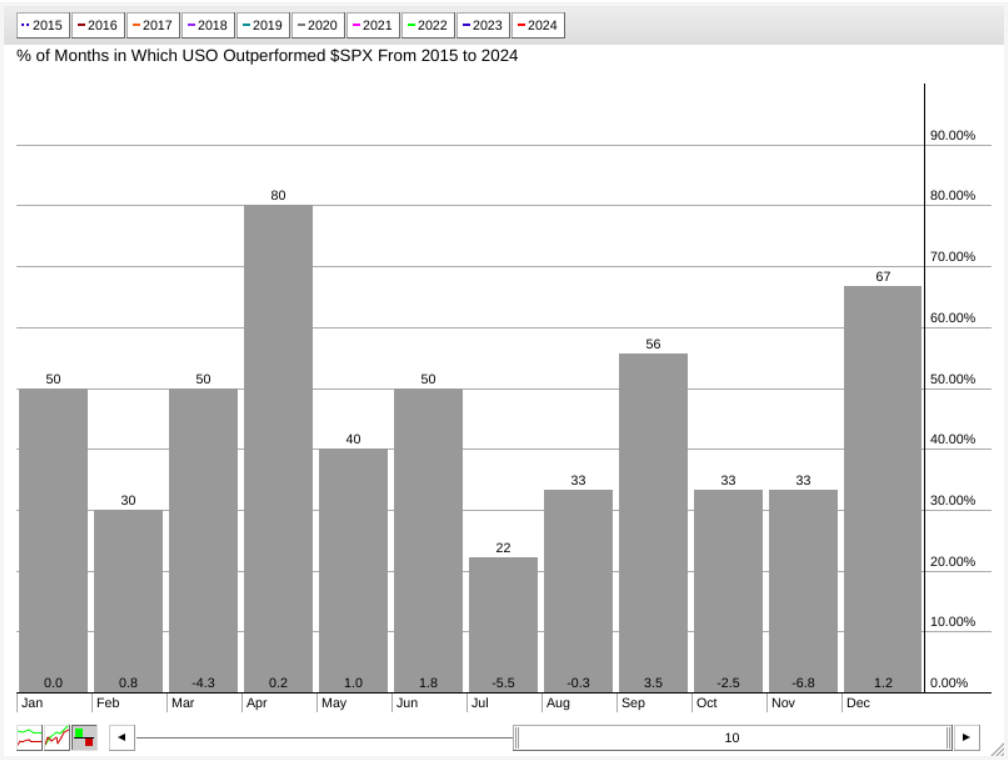
CHART 1. 10-YEAR SEASONALITY CHART OF USO AGAINST THE S&P 500. Be sure to look at the higher-close rate (above the bars) and the average return (bottom of the bars).
Over the last 10 years, and relative to the broader market, July is USO's second-to-worst-performing month in terms of average return (-5.5%) and worst month in terms of higher closes (only 22%). In August, its negative performance eased up a bit, leading to its best seasonal performance in September, with a higher-close rate of 56% and an average return of 3.5% against the S&P. So is August a favorable month to add positions if you're looking to go long on crude oil?
Brent Crude Oil (BNO as proxy)
Brent crude (BNO) has a similar profile, but its September performance has a stronger higher-close rate (78%) than USO (which tracks WTI crude) and with a slightly higher average return of 3.9%.
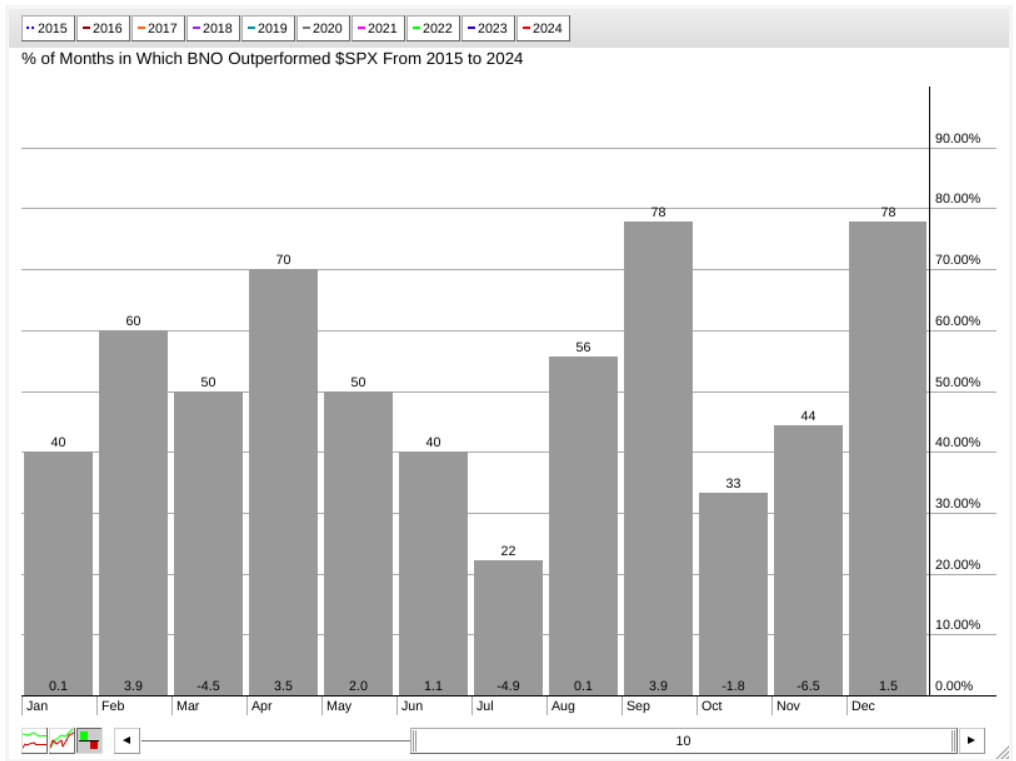
CHART 2. 10-YEAR SEASONALITY CHART OF BRENT CRUDE OIL AGAINST THE S&P 500. Note that September is the BNO's strongest month relative to the S&P.
RBOB Gasoline (UGA as proxy)
While most investors don't deal much in gasoline futures, it's a commodity that our wallets know quite well (with either pain or relief at the pump). As the seasonality chart below shows, gasoline prices tend to rise in the spring (see April) and summer (see September) due to shifts in gasoline blends (among other, less consistent factors such as refinery maintenance, crude oil prices, refining costs, etc.).
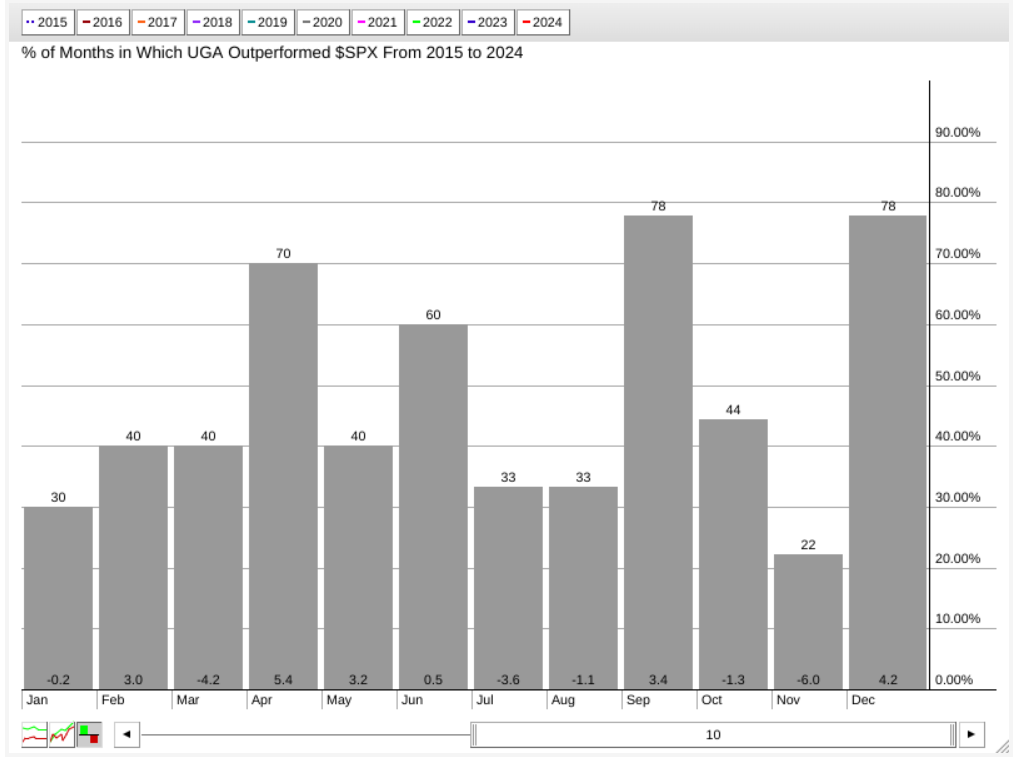
CHART 3. 10-YEAR SEASONALITY CHART OF RBOB GASOLINE AGAINST THE S&P 500. Take a look at April, September, and December. You'll see how these look on the daily chart later in the article.
Relative to the broader market, UGA (United States Gasoline Fund) exhibits similarities to WTI and Brent. Its negative performance in July and August led to stronger performance in September, with a higher-close rate of 78% and an average return of 3.4%. Note, however, that its April and December performances are the strongest.
Natural Gas (UNG as proxy)
Natural gas has been the weakest-performing asset among the group, being the only one to exhibit negative year-over-year returns. However, it's noteworthy that UNG holds exceptional seasonal performance (against the S&P) in August, setting it apart from the other three assets.
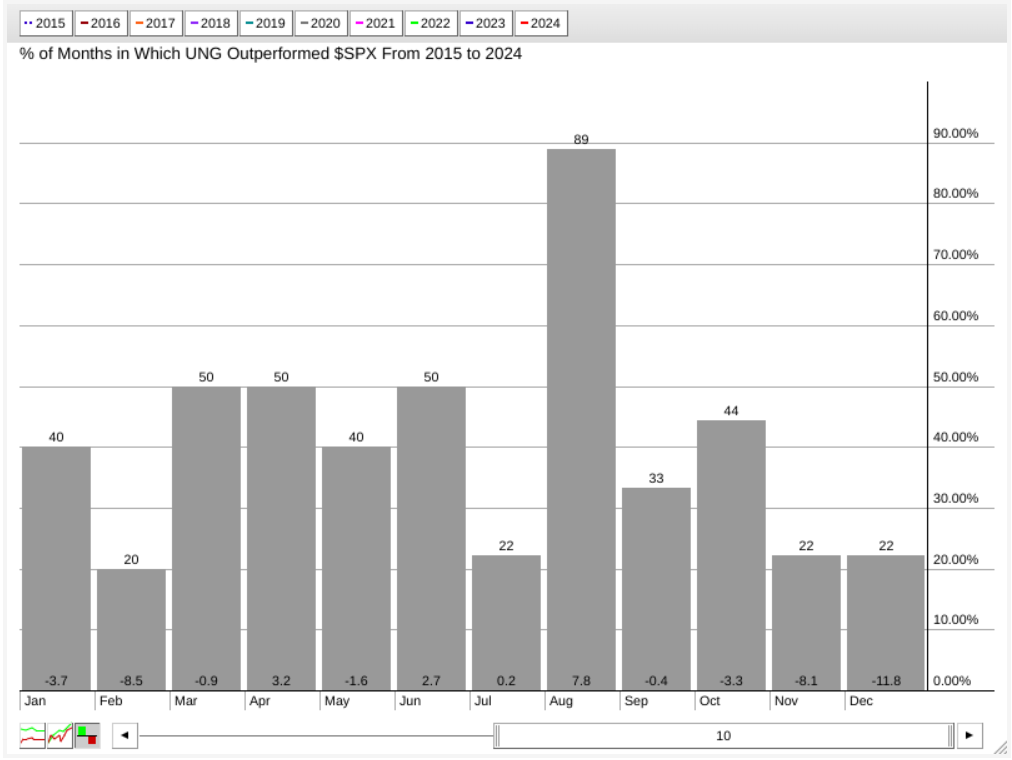
CHART 4. 10-YEAR SEASONALITY CHART OF NATURAL GAS AGAINST THE S&P 500. Natural gas spikes in August. Will this rally materialize this summer?
Over the last 10 years, UNG has had a higher-close rate of 89% and an average return relative to the S&P of 7.8%. What accounts for this? Increased demand for electricity, hurricane season, and lower storage levels during the summer are among the factors that tend to make natural gas jump in August.
Levels to Watch for USO, BNO, UGA, and UNG
USO
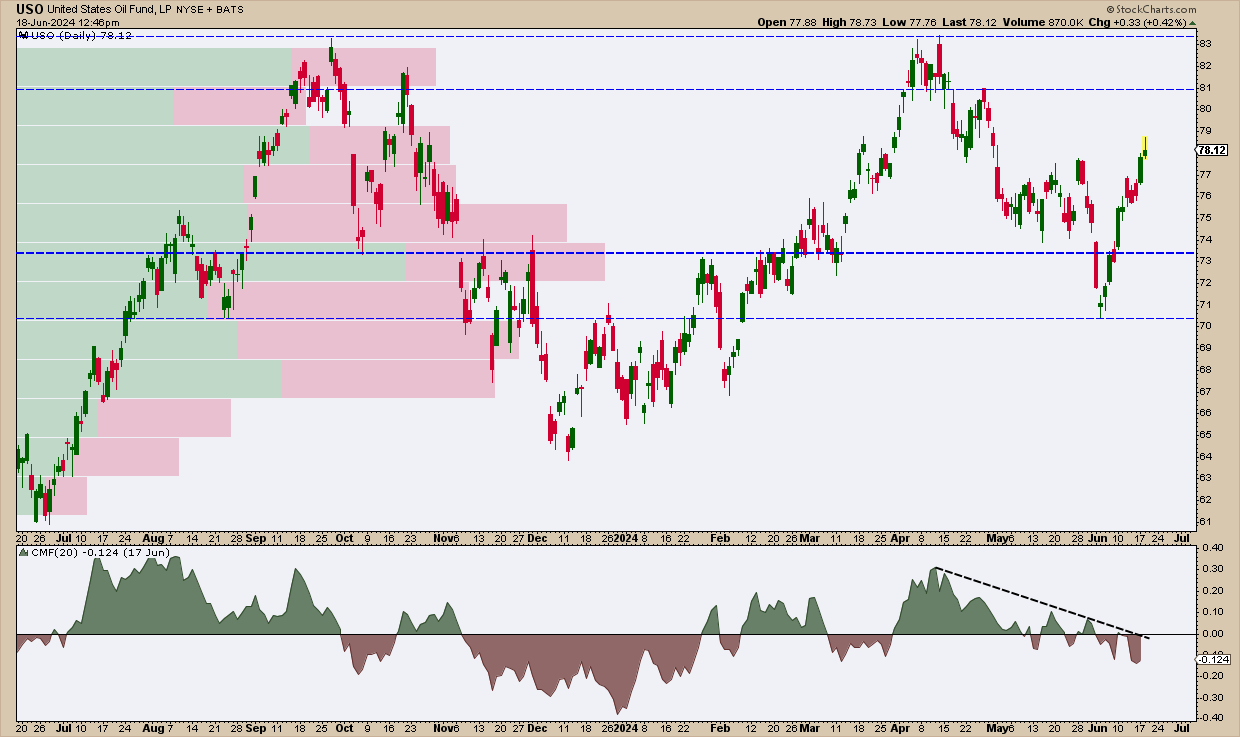
CHART 5. DAILY CHART OF USO. Price is rallying, but buying pressure is sinking.
USO is attempting to rally, but, despite the sharp price rise, momentum has given way to selling pressure, based on the Chaikin Money Flow reading. The bulls' objective is to get USO past $81—a swing point coinciding with a cluster of 2022 resistance levels not shown in the chart above—to just above $83, marking the 2023 and 2024 highs. The bears aim to pressure prices back between $74 and $73, a formidable support level with tremendous volume concentration (based on the Volume by Price indicator reading), possibly down to $70, which marks the current swing low.
Overall, USO looks bearish in the near term, but, if it does fall between $70 and $73, that range might be a favorable entry point for those looking to take advantage of a potential seasonal surge in September.
BNO
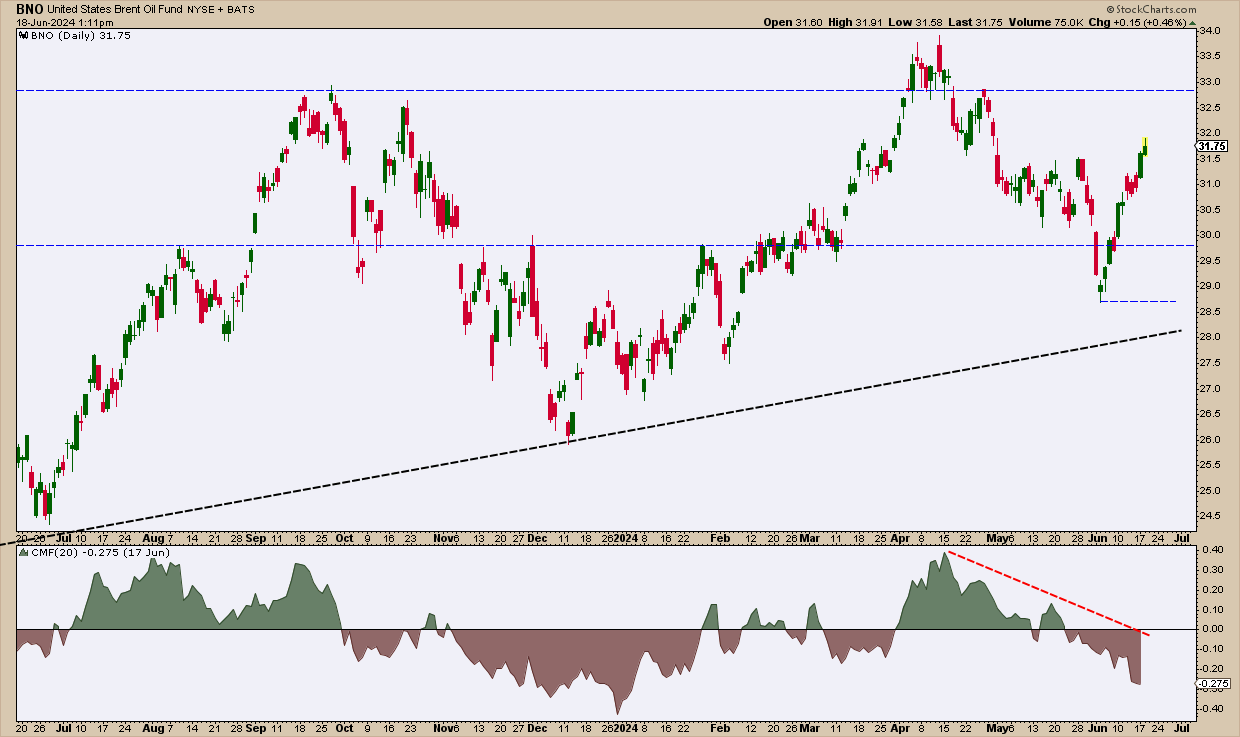
CHART 6. DAILY CHART OF BNO. Note the divergence in momentum, which is similar to USO.
As Brent crude is correlated with WTI, BNO's CMF reading is not that different from USO's; both show dwindling momentum. However, the thick black dotted line highlights a long-term uptrend that can be traced back to 2022 (not shown in the chart above). While the bears' objective is to see BNO's price fall below support levels just under $30 and $29, the uptrend line, which would rise to around $28.50, would likely serve as a strong support level, particularly for those aiming to wager on a September seasonal price increase.
UGA
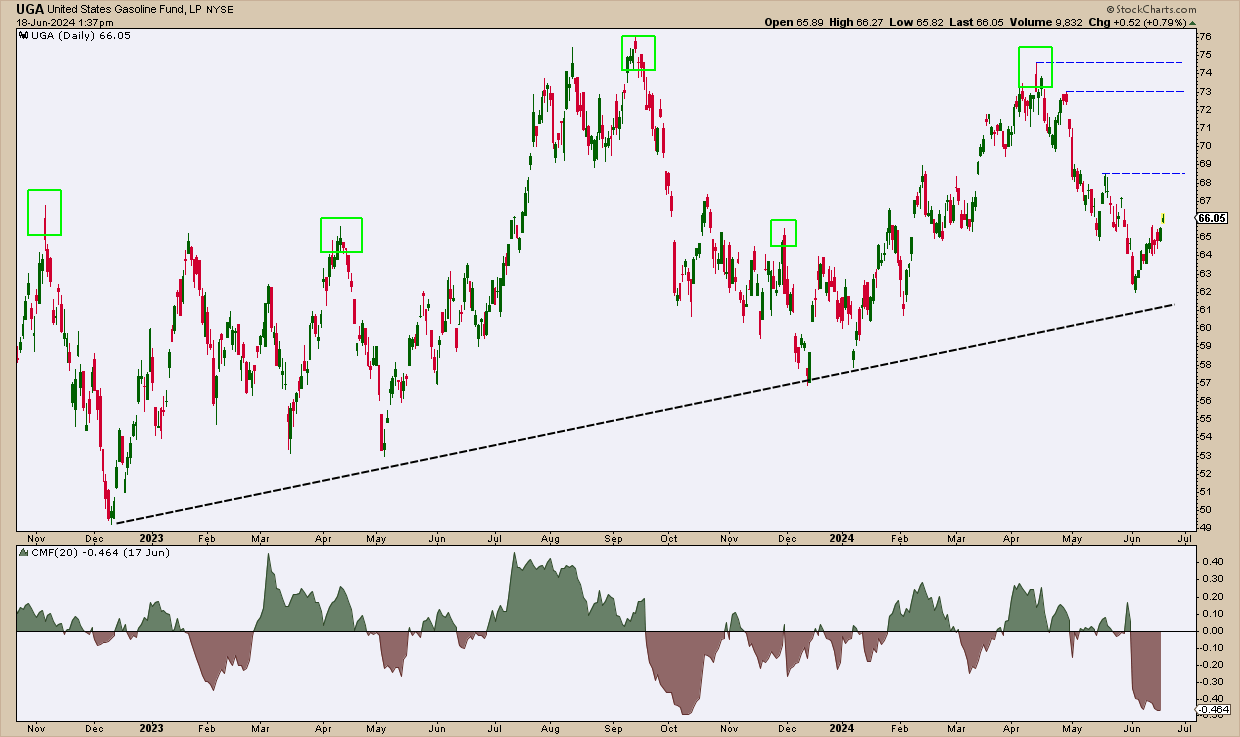
CHART 7. DAILY CHART OF UGA. Note the April, September, and December price spikes.
Assume that everyone is a bear when it comes to RBOB gasoline, as not even a bull would want to pay higher prices at the pump. Still, April, September, and December are UGA's strongest seasonal months, and the green rectangles highlight these price spikes.
Momentum-wise, the CMF is deep into negative territory, indicating severe near-term weakness (a relief at the pump?). But September is just around the corner. If you're looking to take advantage of this seasonal play, you can expect support at around $62 (see trendline), but keep an eye out for resistance at $68.5 and the $73–$74 range. The all-time high, reached in 2022, is at $80.
UNG
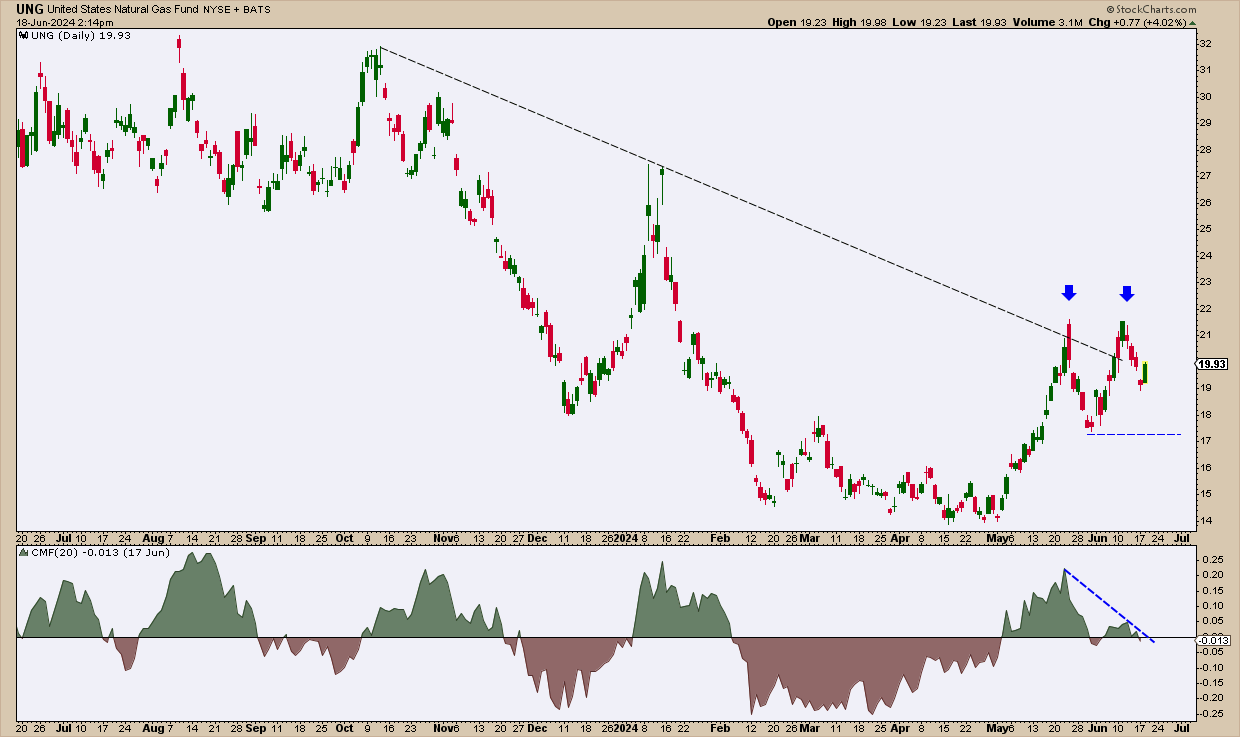
CHART 8. DAILY CHART OF UNG. Double top?
Natural gas, UNG, shows a clear break above the downtrend line, but is it double-topping (see blue arrows)? Supporting the likelihood of a near-term top is the decrease in buying momentum, as shown in the downsloping CMF.
UNG's August seasonal surge hasn't been as pronounced as it has been through most of the decade due to increased production, warmer weather, and high inventory levels. But if you want to position your portfolio for a potential rally in the next few months, the swing low at $17 (or the 2024 low at $14) might make for favorable entry points.
The Takeaway
As we move into the summer, energy demand usually increases, particularly for crude oil and gas. While seasonal plays can be attractive, they aren't always reliable. And that's why it's best to look at the price action to seek potential tactical entry points when taking advantage of seasonal opportunities. Also, it's important to consider the wider geopolitical and macroeconomic contexts, as those factors can significantly alter the supply and demand picture for these commodities.
Disclaimer: This blog is for educational purposes only and should not be construed as financial advice. The ideas and strategies should never be used without first assessing your own personal and financial situation, or without consulting a financial professional.
Happy charting!


