TAKEAWAYS
- Silver may be the next big "AI trade"
- While silver ETFs are seeing large outflows, silver futures are telling a different story
- Understanding silver's seasonal pattern and identifying the key levels to watch are critical
Over the last few years, the "AI trade" has shifted from the hottest trend to a portfolio centerpiece. The rationale for the shift is obvious: it's hard to imagine future technology without AI.
But while the AI trade revolves around the usual suspects—semiconductors and various big tech stocks—silver is a critical yet overlooked component supplying the entire AI industry.
Silver's Role in the AI Industry
Silver isn't the only metal in AI tech production; its role is critical. Without it, AI—and much of electronic tech—wouldn't exist. Its applications in thermal conductivity, semiconductor fabrication, sensors, connectors, and photovoltaic cells make silver indispensable in AI tech production.
The Silver Institute says global silver demand is set to hit around 1.2 billion ounces this year, the second-highest level ever recorded. Even with more silver being produced in response to industrial demand, analysts still believe the market will be in deficit for the fourth year in a row.
Silver's 5-Year Seasonality Chart
Take a look at silver's ($SILVER) five-year seasonality performance using StockCharts' Seasonality chart tool.

CHART 1. 5-YEAR SEASONALITY CHART OF SILVER. Note the volatile performance quarter by quarter.
First, why a five-year seasonality chart? The answer is that it gives more weight to silver's industrial demand and the AI trade starting in the year before the COVID lockdown. Still, if the market has been in a supply deficit for four years while demand keeps rising, you might wonder if the current price is somehow ‘repressed,' setting the stage for a big surge.
- Over the last four years, silver has returned, on average, 8.5% this month (average returns are at the bottom of the bar).
- August and September show the summer doldrums, with the latter's figure looking quite dismal.
- October through December, the best months, topped even that of March through May in terms of average returns and, to some extent, higher close rates (those are the numbers above the bar).
Silver's Macro View Shows Major Breakout
Looking back at silver's performance over the last 16 years, the white metal is breaking out of a wide (and very ugly) four-year trading range.

CHART 2. WEEKLY CHART OF SILVER. Silver just broke out of a four-year (and very volatile) trading range.
Looking at the Chaikin Money Flow (CMF) indicator, you can see how the rallies correspond to the increased buying pressure. The current reading may not be as dramatic as the levels seen in 2010 and 2011, but this is where you make an informed guess as to whether such a move is about to start.
Silver's price broke above the four-year resistance level at $30. However, it faces technical headwinds at approximately $36, $44, and right below $50 (the highest level reached was $49.45 in 1980 and $48.70 in 2011).
Are Big Players Scooping Up What Retail Investors Are Ditching?
Before looking at the daily chart from a tactical perspective for some potential entry points, let's first compare the silver futures market ($SILVER) to the iShares Silver Trust ETF (SLV) and focus specifically on the different readings from the CMF, which represents buying vs selling pressure.

CHART 3. DAILY CHART COMPARISON OF SILVER FUTURES VS ISHARES SILVER TRUST ETF. Notice the difference in money flow between the two.
The price correlation between the two markets is very tight, as SLV is a commodity-backed ETF. But look at the difference in money flow. The futures market shows a positive reading while the ETF dipped into negative territory.
Does this represent the sentiment of different types of market participants—namely, institutional investors (or commercial traders) versus retail investors? If so, might it indicate that the bigger players are buying what the retail traders are selling to them at a possible discount? It's something to think about.
Analyzing SLV's Near-Term Price Action
Take a look at the daily chart of SLV below. The StockCharts Technical Rank (SCTR) score is soaring above the 90 line, indicating technical bullishness across several indicators and timeframes.
The CMF is below the zero line, indicating retail investors may be liquidating positions. However, is quiet accumulation occurring among institutional players in the futures market amid retail selling?
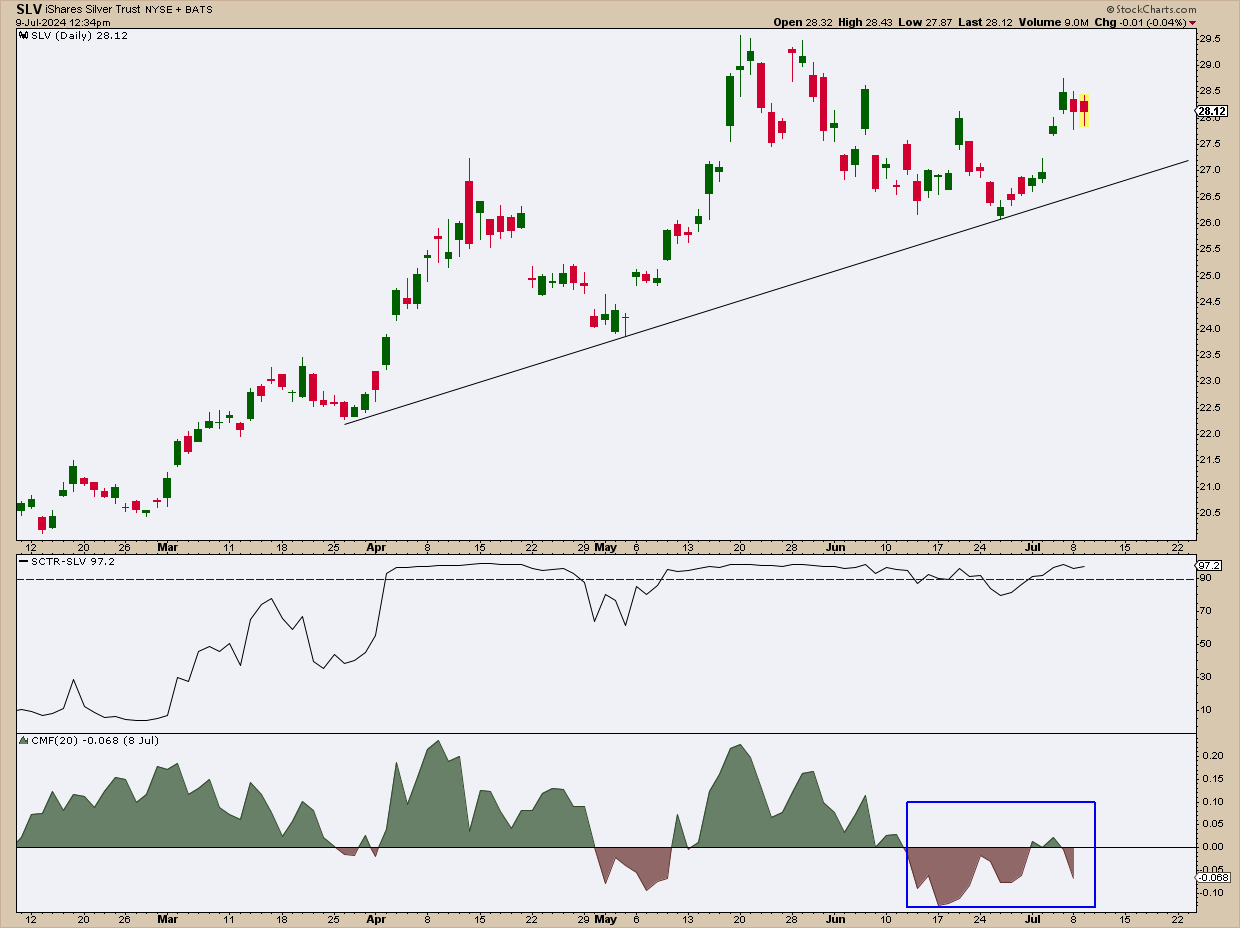
CHART 4. DAILY CHART OF SLV. The CMF divergence is clear, but given how it almost contradicts the reading you get with silver futures, it almost changes the story the charts tell.
Take a look at the trendline (black) on the SLV chart. If silver's seasonal tendency materializes, then you would expect near-term weakness. SLV's price will likely test the trendline first (at whatever price point that will be at the moment) before testing the most recent swing low at $26.00. Should the price break below that level, you can expect support at the next major swing low at $24.00.
If price falls below that, there is further support at consecutive swing lows, but you will want to re-examine the macro situation before taking any further action.
Add the following two charts to your StockCharts ChartLists.
The $SILVER chart shows what the silver futures (continuous contracts) price action looks like in contrast to the iShares Silver Trust ETF (SLV). The ETF is designed to track the futures, but look closely—those little technical differences might lead you to hidden market opportunities.
Closing Bell
Not many retail traders see it, but silver shines in the AI world. AI's rise as a portfolio must-have puts a spotlight on silver's critical role in tech production. But there's a catch—silver supply may not be keeping up with soaring demand. While silver futures show strong buying, retail investors are ditching the SLV ETF. Big players might be scooping up what retail traders are selling, potentially setting the stage for a massive price surge later in the year.

Disclaimer: This blog is for educational purposes only and should not be construed as financial advice. The ideas and strategies should never be used without first assessing your own personal and financial situation, or without consulting a financial professional.
Happy charting!
