TAKEAWAYS
- With Fed rate cuts now widely anticipated, investors are looking to the biotech industry for potential investment opportunities.
- Biotech, a highly-speculative industry, has declined sharply since 2020 as inflation, along with higher interest rates, set in.
- You can spot green shoots of capital flowing into biotech; watch the technical levels for signs of follow through and, eventually, rebound.

Perhaps no other industry in the world is more synonymous with risk and emergent (R&D) developments like biotechnology. While the information technology sector has been a dominant driver on Wall Street since the big tech revolution in the 2000s, biotech, a subset of the healthcare sector, took a sharp nosedive during the pandemic in 2020.
By 2020, 80% of all biotech companies were losing money. Near-zero interest rates made it easy for biotech companies to continue raising capital to fund their operations. But as the Fed began raising interest rates a few years later to combat rising inflation, the capital lifeline was cut, and the biotech industry cratered.
But now, with Fed rate cuts on the horizon, Wall Street may be eying this beaten-down industry, currently trading with bargain basement valuations. Does this present an opportunity for a long trade?
Biotech vs. the Broader Healthcare Sector
Let's look at biotech starting at its 2020 top and compare it to the broader healthcare sector. We'll use the following industry and sector proxies:
- SPDR S&P Biotech ETF (XBI) for our biotech industry proxy
- Health Care Select Sector SPDR Fund (XLV) for our sector proxy
Go to your StockCharts Dashboard and open up PerfCharts. Type in XBI,XLV and drag the bottom timeline slider to around 932 days. It should look like this:

CHART 1. PERFCHART OF XBI AND XLV. The chart starts when XBI hit a top in 2020.Chart source: StockCharts.com. For educational purposes.
To get an idea of relative performance, this shows you just how much the biotech proxy has been underperforming healthcare over the last three years.
With that knowledge, what's going on today with regard to biotech relative to its sector? Why not get a quick glance at the Advancers & Decliners?
In one of the data panels on your StockCharts dashboard, select the More button and click Advancers & Decliners > US Sectors. On Tuesday (mid-day), this is what I saw:
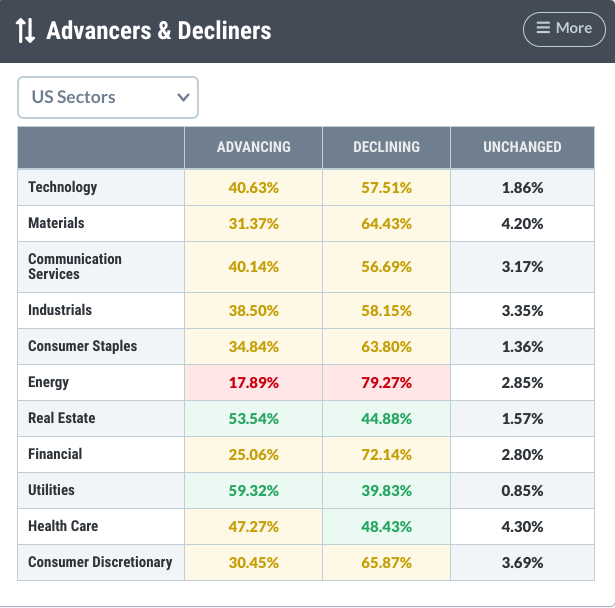
CHART 2. ADVANCERS & DECLINERS BY SECTOR. Notice that the number of advancing and declining stocks are neck-and-neck.Image source: StockCharts.com. For educational purposes.
This tells me something about healthcare as a sector—namely, that the number of stocks going up and down is nearly the same. But it doesn't tell me much about biotech as an industry.
So, let's check the StockCharts Sector Summary and drill down.
Open the page and click on XLV. You should see each individual industry. Let's select a three-month look-back to get a bigger picture of industry performance. This is what I got:
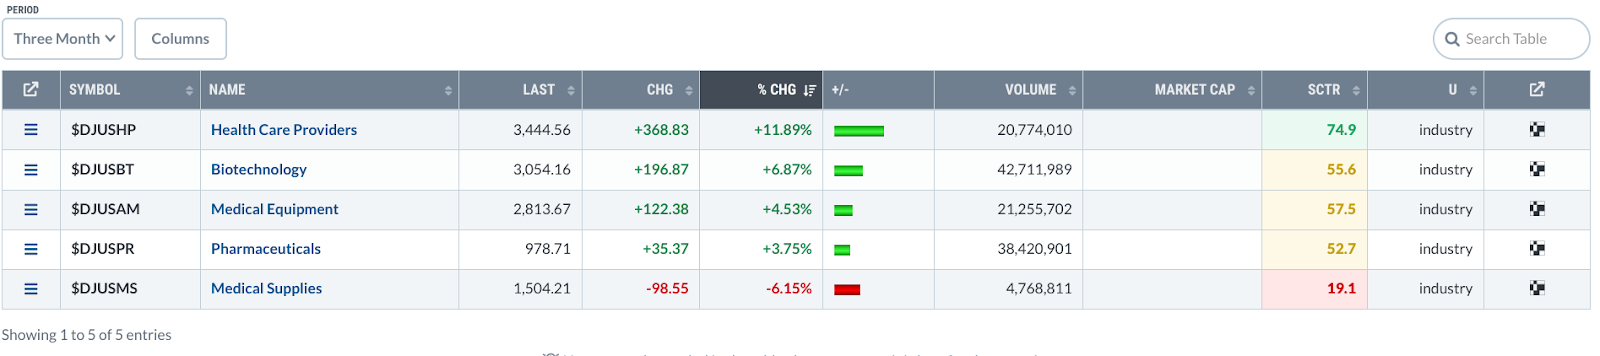
CHART 3. 3-MONTH INDUSTRY VIEW ON STOCKCHARTS' SECTOR SUMMARY. Biotech rising?Image source: StockCharts.com. For educational purposes.
This tells you that, over the last quarter, biotech's market performance has been second only to healthcare providers. But take a look at the volume. It has the highest volume of trades in the entire sector. Could this mean that Wall Street is steadily accumulating biotech stocks, fueling its rise to date? If so, is biotech on the verge of an upside trend reversal?
Let's look at a daily chart of XBI to see what the price action says.

CHART 4. DAILY CHART OF XBI. There's a very wide ascending triangle formation in the price chart; the stochastic oscillator is starting to turn higher above the 20 level, and On Balance Volume is trending higher.Chart source: StockCharts.com. For educational purposes.
Here are the main points to watch:
- XBI has been trending upward since late April, and it's about to challenge the $103 range (see blue dotted line) marking the March 2023 high and this year's July and August highs, forming a long ascending triangle pattern which leans on the bullish side.
- Price appears to be bouncing off the stochastic oscillator's 20 line (see orange circle), just above oversold territory.
- The On Balance Volume (OBV) indicator, whose founding principle is "volume precedes price," shows that buying pressure is on a steady uptrend, mirroring XBI's price action.
For XBI's uptrend to remain valid and to see if Wall Street capital begins flowing into biotech ahead of the anticipated Fed rate cuts, XBI will have to break through resistance at the $103 range while staying above the current trend line (see solid blue trendline) or the last major swing low at $91.
At the Close
Here's the takeaway: Biotech has had it rough since its 2020 peak, but there could be some light at the end of the tunnel. With Fed rate cuts on the horizon, Wall Street might be eyeing this beaten-down industry for a rebound. Keep an eye on the technical levels to spot any hint of major market moves before the rest of the crowd catches on.
Last but not least, be sure to save XBI in one of your StockCharts ChartLists.

Disclaimer: This blog is for educational purposes only and should not be construed as financial advice. The ideas and strategies should never be used without first assessing your own personal and financial situation, or without consulting a financial professional.
Happy charting!


