The world of Crypto has become far more mainstream in the past year, with increased institutional involvement. Not only that, but 70% of retail investors traded crypto in 2021. As a space becomes crowded, it is often felt that the major opportunities disappear. However, whilst easy gains are likely to be things of the past and there is market talk of a Crypto winter, my personal view is that institutional acceptance removes much of the doubts about Crypto remaining the Wild West and liable to regulatory roadblocks. There is no doubt that Web3 and NFTs can provide amazing opportunities if you are prepared to put in the work. That is what I have been doing for the past year and have now reached the point where I'm comfortable in the space.
StockCharts has greatly increased its coverage in Crypto, with there now being well over 100 instruments. Data history is comprehensive and the quality very good. I monitor around 60 on a daily basis using 4-hour charts to gauge the short term behaviour and daily charts for a historical prospective. Whilst this may seem daunting, what rapidly became clear to me was the need to watch so many in order to gauge the relative strength between different types of Crypto and performance between those in the same space.
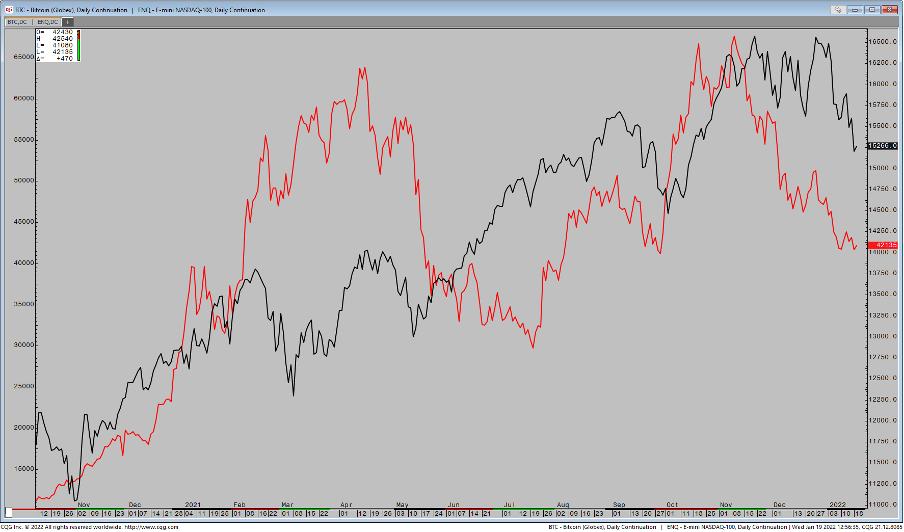
It's true that there are strong correlations across the whole spectrum and, therefore, this understanding of relative performance is essential. Recent history shows that we may not be trading Crypto at all, but the Nasdaq. That is true up to a certain extent, but in truth, when the Nasdaq has rallied during the part few months, Crypto hasn't gone up very much, whereas when the Nasdaq falls, many Cryptos tank.
This chart shows an overlay of Bitcoin against the Nasdaq over the past year. Note how Bitcoin has underperformed since last November, dropping 30% into year-end as the Nasdaq remained close to its all-time highs.
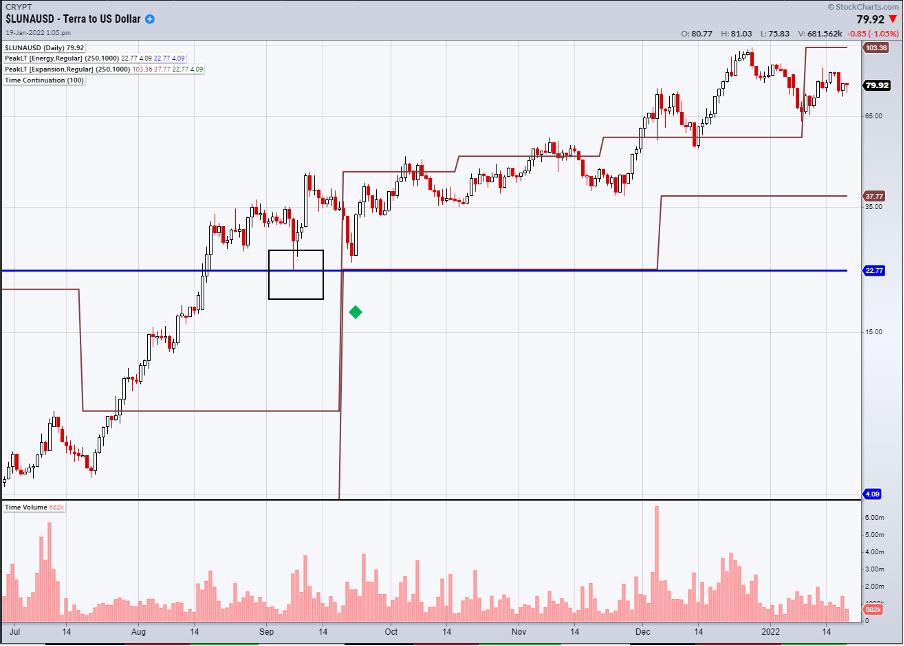
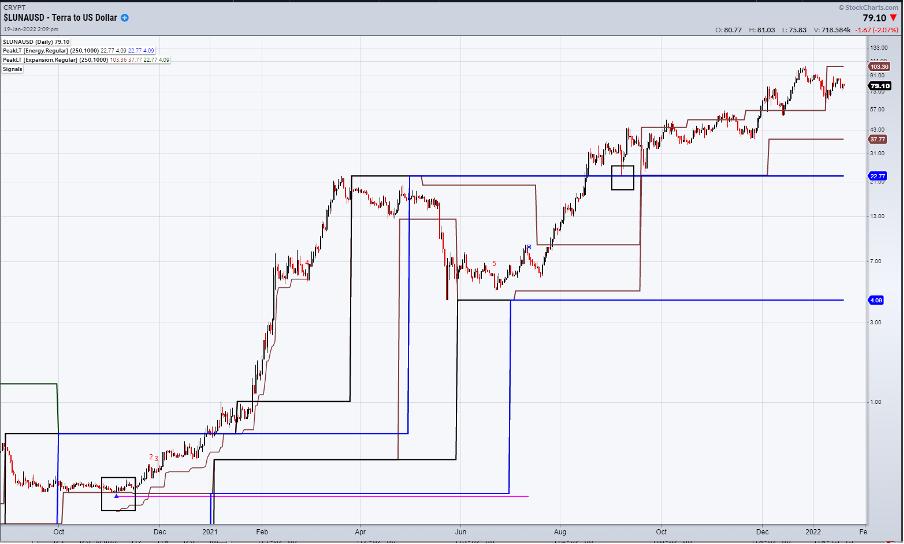
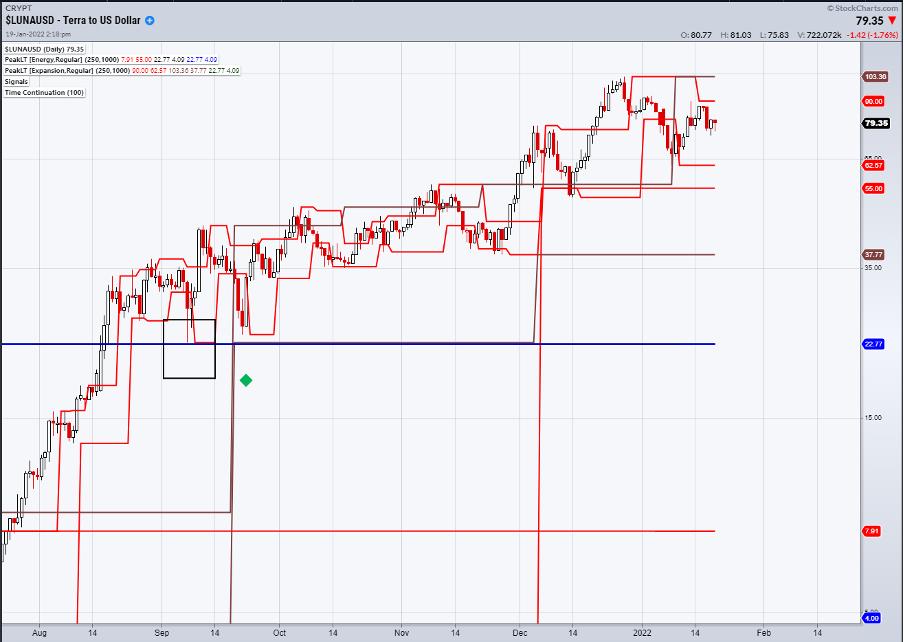
Contrast this with Luna, which has been in a steady uptrend since last year. The key moment came in September, when price held the major Monthly Based Peak Energy Support (Blue Line) and then, a few days later, posted a buy signal with a Time Continuation pattern (green diamond).
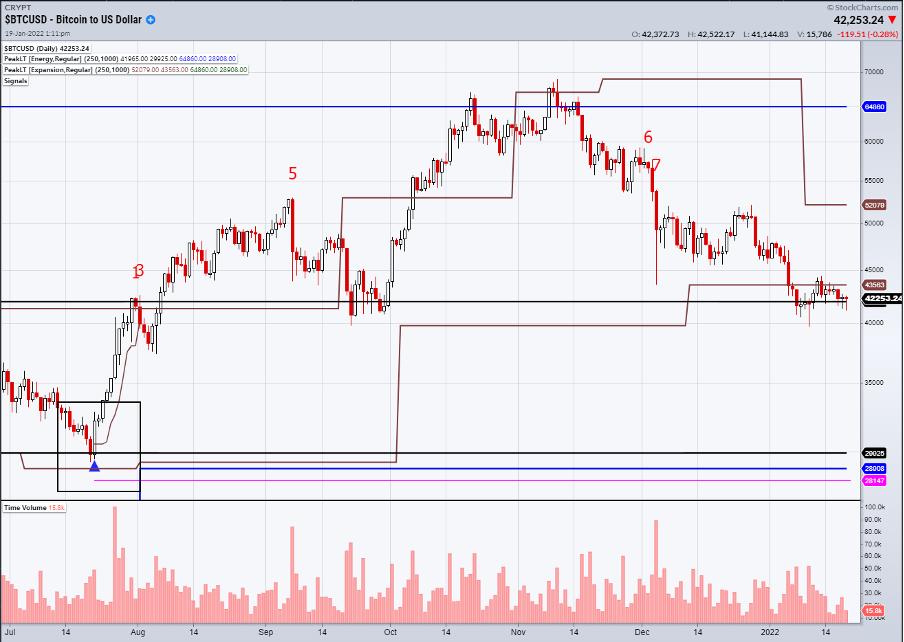
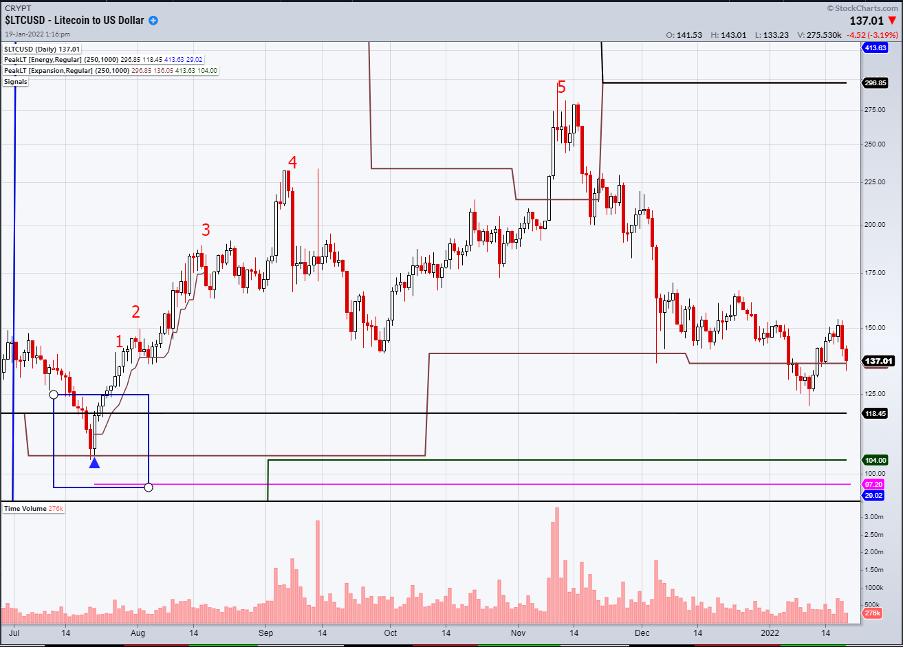
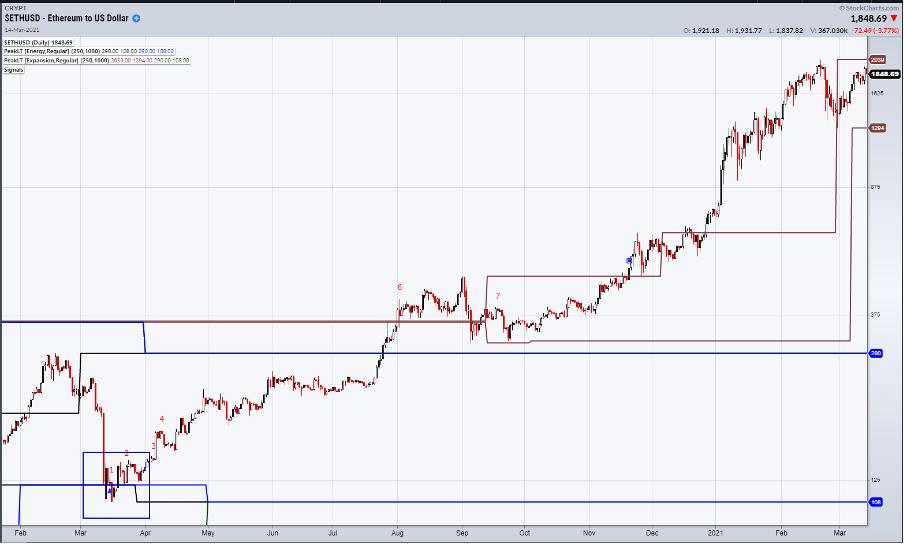
Whilst it is possible to wait for patterns, the 4th Dimension System also provides signals. They are rare, but often significant. Last year, Ethereum, Bitcoin and Litecoin all gave major buy signals on the same day.
Bitcoin entered a major weekly based zone of support in July, and a pattern within that zone triggered a signal (blue triangle) at $32100.
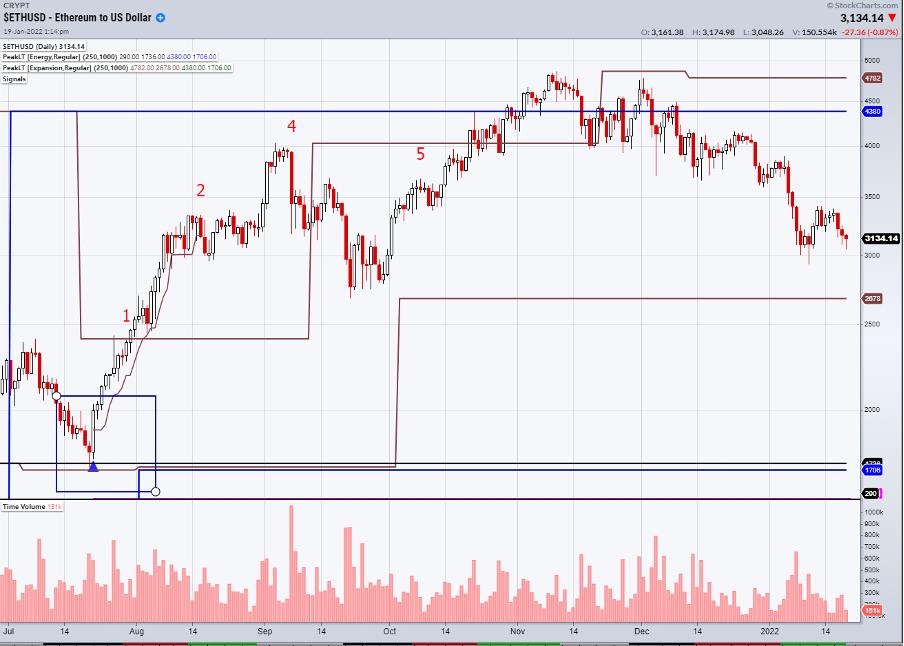
Ethereum did the same, entering a weekly zone at $2100.
Litecoin's zone of support was wider, but it gave a signal at $117.
Ethereum's only signal came a little earlier in March, at $125, after swiftly losing 70% of its value.
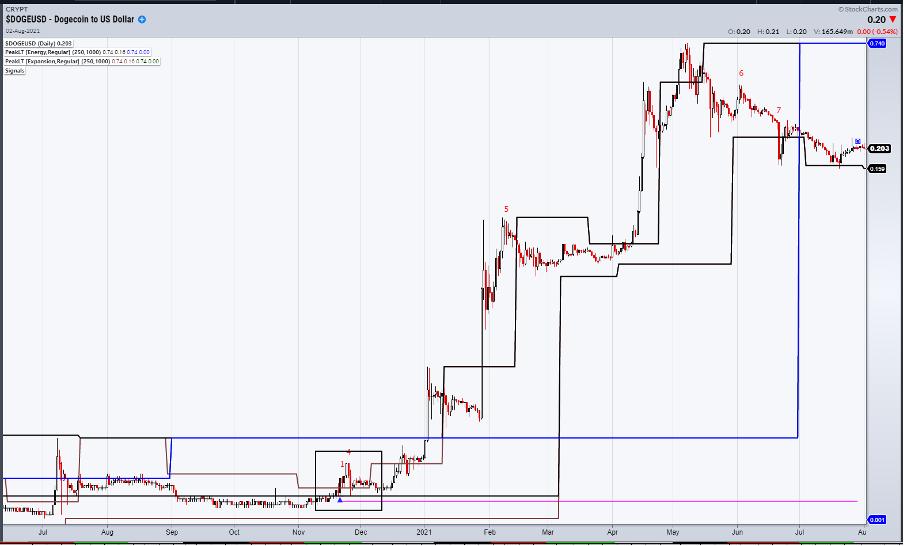
Going back through history and observing many such signals on all sorts of instruments was enough to get me serious. Whilst the type of returns these signals gave is unrealistic now, the evolving world of NFT and Crypto means that new opportunities will present themselves. The buy on Dogecoin back in November 2020 was at such a low price that the StockCharts scale has it at zero!!! It is necessary to scroll back and adjust the scale to see that the buy came in at $0.0032.
Returning to Relative Strength, we already know that Luna is outperforming. The others are Atom and Fantom. Starting with Luna, the buy back in November 2020 was at 29 cents. At its recent peak above $100, it's up over a staggering 30,000%. Now you see why I got serious.
The 4th Dimensions System triggers signals only at weekly- or monthly-based support. This was designed that way due to the large number of stocks in America. The crypto world is smaller and more manageable, so it is possible to modify this to include daily supports and resistances as well.
Returning to Luna, the Red Lines are the daily levels. We have supports at $62.57 and $55.00, with a weekly based support all the way down at $37.77. With the prevalence of Flash Crashes, especially at weekends, I have no problem having a cheeky order down there. Resistance has been built based on its own momentum, so a day-to-day close above the weekly resistance at $103.38 would signal a breakout.
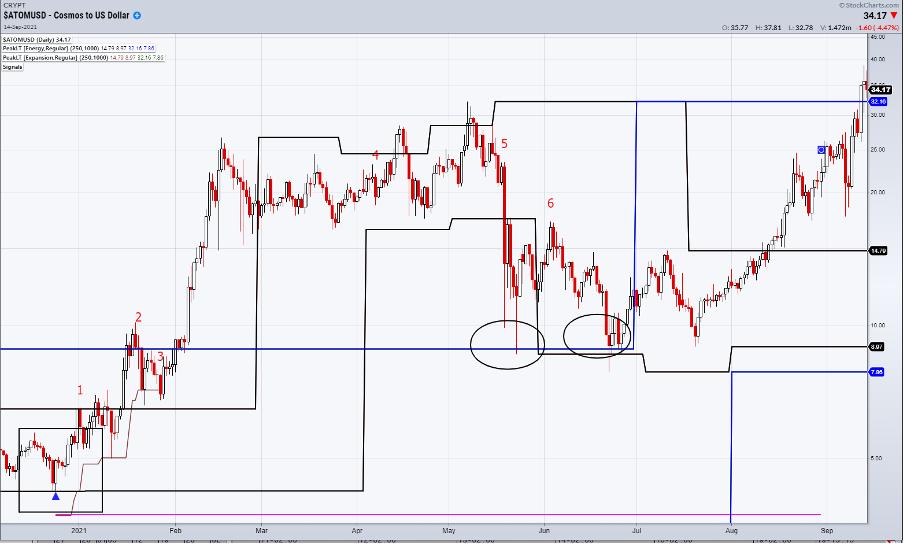
Moving onto Atom, the last 4th Dimension signal was at the end of 2020 at $5. Price did respect monthly support twice during the following summer, but did not produce a pattern.
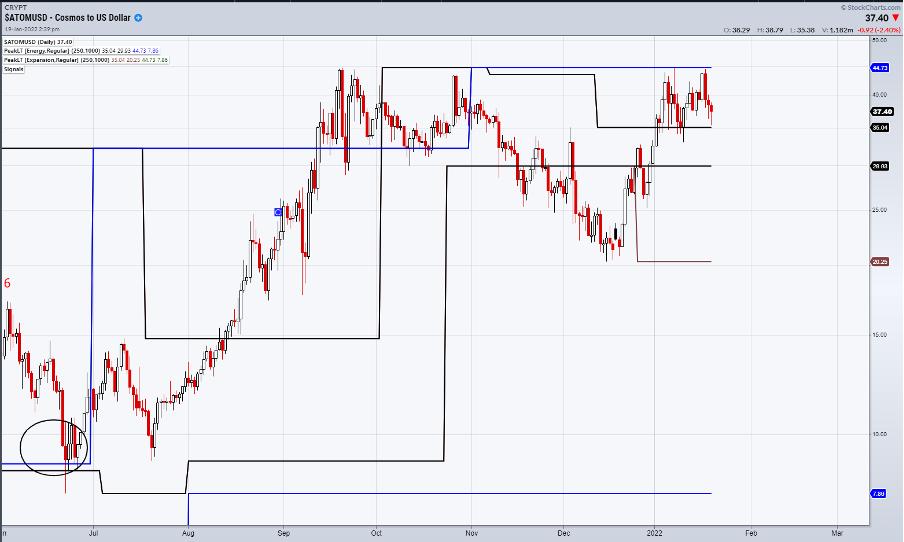
Moving to now, weekly levels are more relevant and closer, with support at $35.04 and $29.93. The Flash Crash level is $20.25. The past two weeks has seen failure at the final monthly-based resistance at $44.73, which means a 2-day close above here would signal a bullish breakout.
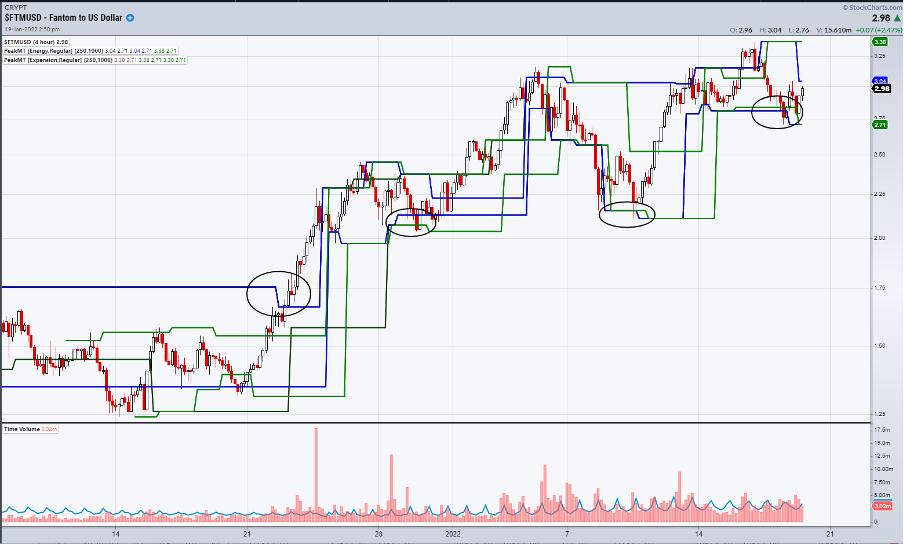
Fantom has been ignoring the general downtrend in Crypto and sits close to its all time high. Fundamentally, it is a Crypto similar to Ethereum in its place within the digital framework. The historical data is more limited than the others, so no 4th Dimension signal has appeared as of yet. However, daily support lies at $2.11 and a Flash Crash level is at $1.17. A 2-day close above $3.55 would signal a bullish breakout.
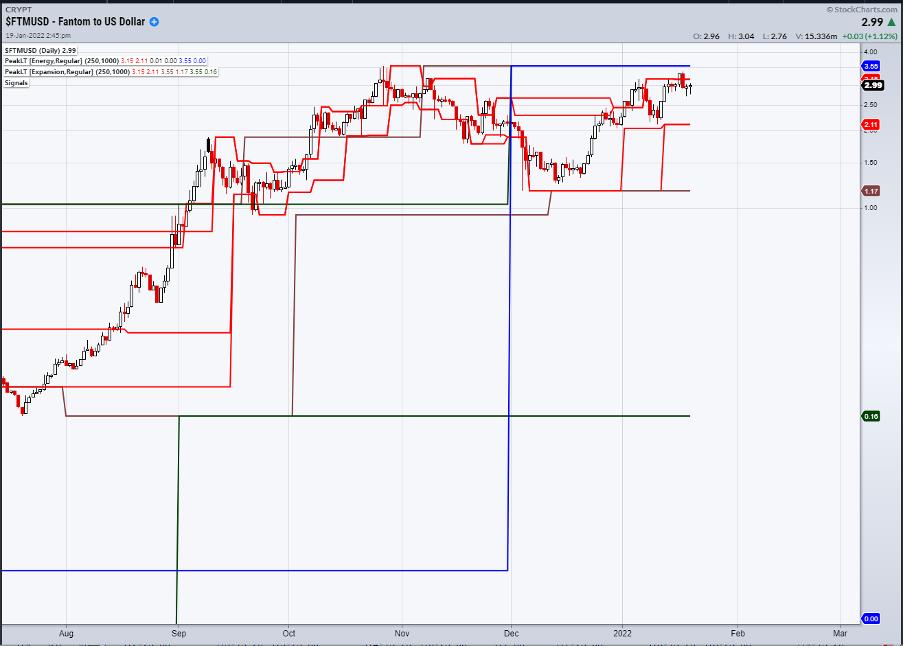
Drilling down further for shorter term opportunities, I use the 4-hour charts with the Peak Expansion and Energy referencing 120-, 240- and 480-minute charts. Price broke out just before Christmas and, 3 times, has held final short-term support on a 2-bar basis as circled. That final level lies at $2.71.
Its fair to say that, with big potential returns, risk is also big.
I can be contacted at shaun.downey@aol.com to answer any questions.
Shaun Downey