Run Lola Run! It's Groundhogs' Day All Over Again
For the second week in a row, the major U.S. stock indexes appeared to be on the verge of an overall gain at midweek, only to end up negative after declining on Thursday and Friday. Indexes fell nearly 2%, as investors read endless analysis on the building tension at the Russia-Ukraine border.
If you are feeling like Franka Potente trying to outrun the mob, or Tom Cruise in Live. Die. Repeat. battling alien invaders each week, there's good news... this isn't a lesson in metaphysical time loop sci-fi, it's just investing! You are in charge of your portfolio, and you can take action to alleviate this frustrating cycle.
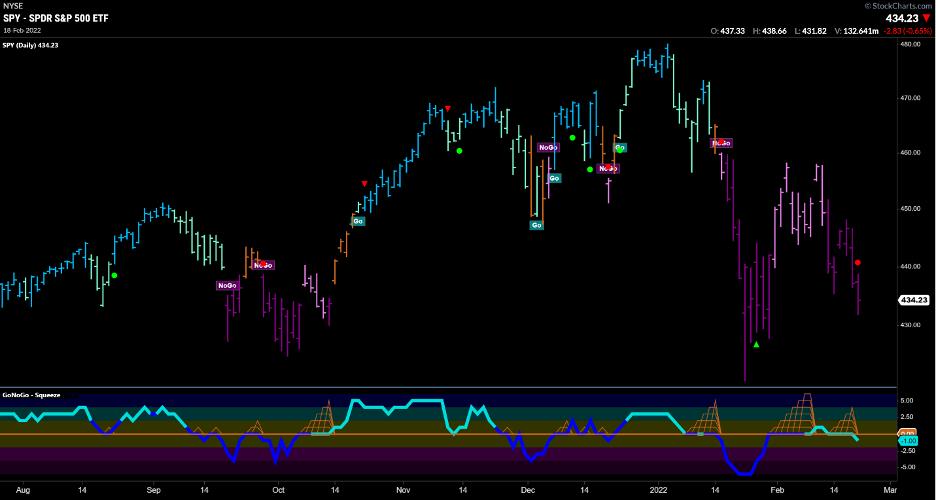
GoNoGo Charts have highlighted the S&P 500 in a "NoGo" trend for most of 2022. Today's issue of Flight Path from GoNoGo Research will cover several alternative investment arenas to consider.
GoNoGo RelMap: S&P Sector Relative Performance
Ten of the 11 S&P 500 sectors ended last week in negative territory. The typically defensive Consumer Staples sector, $XLP, outperformed within the S&P 500 Index. Gaining over 1% last week, the sector was fueled by gains in Walmart $WMT and Procter & Gamble $PG – both countertrend rallies within "NoGo" conditions. A steep decline in Meta Platforms $FB (Facebook) weighed heavily on the Communication Services sector.
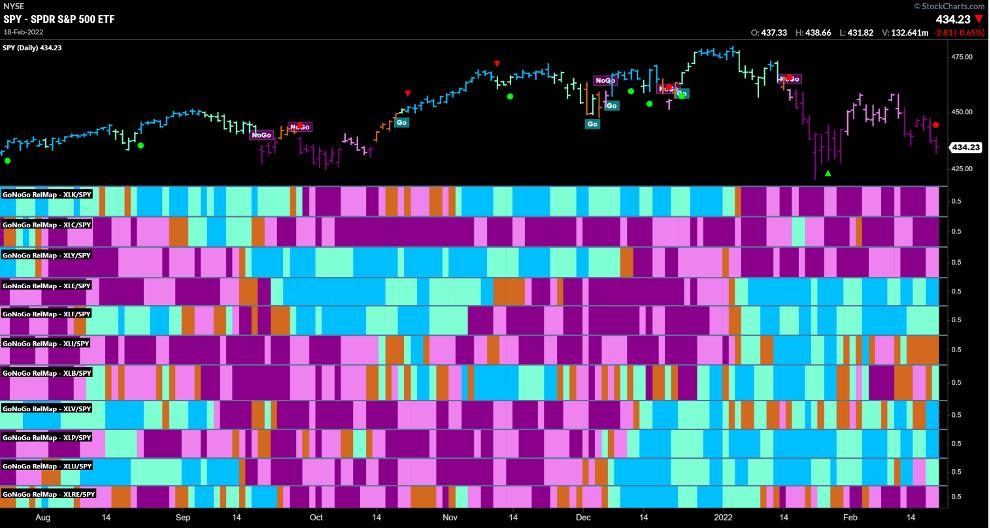
- 6 sectors outperformed the broad S&P 500 Index to end this week
- Energy $XLE, Financials $XLF, and Consumer Staples $XLP maintained their consistent "Go" trends
- Materials $XLB, Healthcare $XLV, and Utilities $XLU gained "Go" trend conditions relative to the S&P 500 last week
- Your top three panels: Technology $XLK, Communications $XLC, and Consumer Discretionary $XLY all remain in "NoGo" trends
- The Energy sector $XLE, while still in a "Go" trend was the laggard last week with a -3.7% decline. Oil prices briefly fell below $90 per barrel losing 2% last week amid reports indicating that a nuclear agreement with Iran was within reach: potentially leading to an increase in global supply.
Work from Home, Shop from Home
On Wednesday, U.S. retail sales data for January came in well ahead of expectations, despite omicron worries. The headline figure was up 3.8% month-over-month; outpacing consensus forecasts of 1.9% and sharply above last month's reading of -2.5%. The gains were driven by notable increases in online sales (non-store), furniture sales and a rebound in auto sales, which were up the most in 10 months.
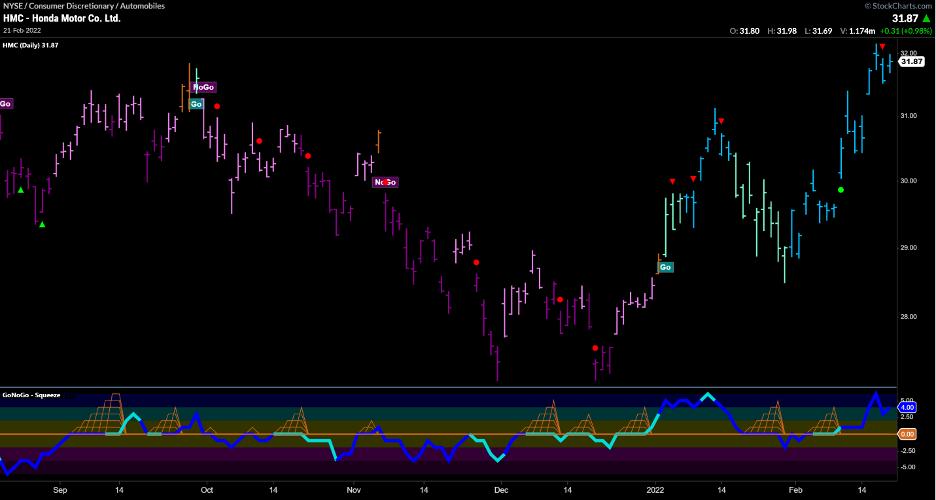
Below is a chart of Honda Motor Company $HMC in a strong "Go" trend. Notice that GoNoGo Oscillator confirms the price rally with positive momentum on heavy relative volume:
This solid retail sales report reflects a relatively healthy U.S. consumer and, perhaps, some waning impacts from the omicron variant towards the end of the month. Wall St. analysts see potential for reopening demand to remain solid in the spring and summer months ahead, particularly if virus trends continue to improve.
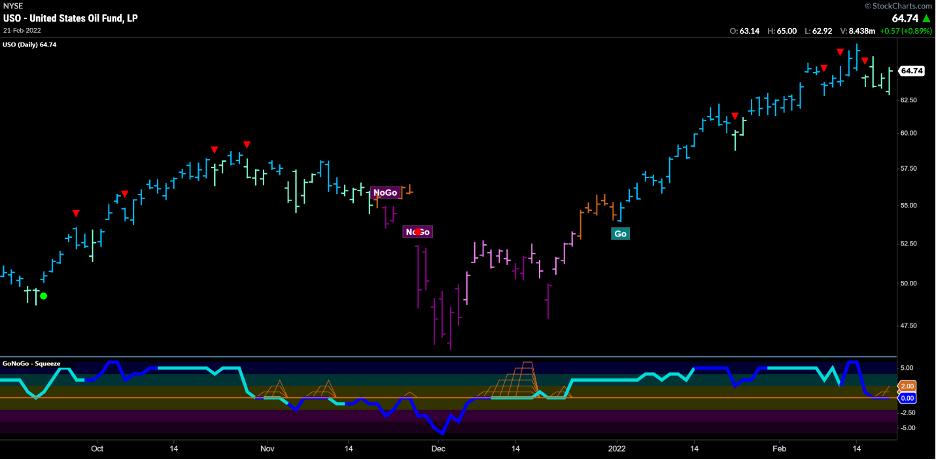
A Pause in the Gushing Oil Rally
An eight-week rally that pushed U.S. crude oil prices from around $70 per barrel to as high as $95 faded slightly last week, as the price retreated to around $92 on Friday. The potential for additional oil exports from Iran helped to offset concerns related to supply disruptions stemming from the continuing Russia-Ukraine conflict. The daily chart of $USO below suggests this trend has the potential to continue, as it remains in a "Go" trend on weaker aqua bars. The countertrend correction arrow signaled the waning momentum shown in GoNoGo Oscillator, which fell from extreme overbought to the zero-line. We will watch this week to see if the oscillator finds support at neutral or breaks down to oversold levels.
Energizer Trade – Lithium
Sociedad Química y Minera de Chile $SQM is a Chilean chemical company and a supplier of plant nutrients, iodine, lithium and industrial chemicals. It is the world's biggest lithium producer. SQM's natural resources and its main production facilities are located in the Atacama Desert in the Tarapacá region. Check out this quarterly chart of $SQM going back to the mid-1990s:
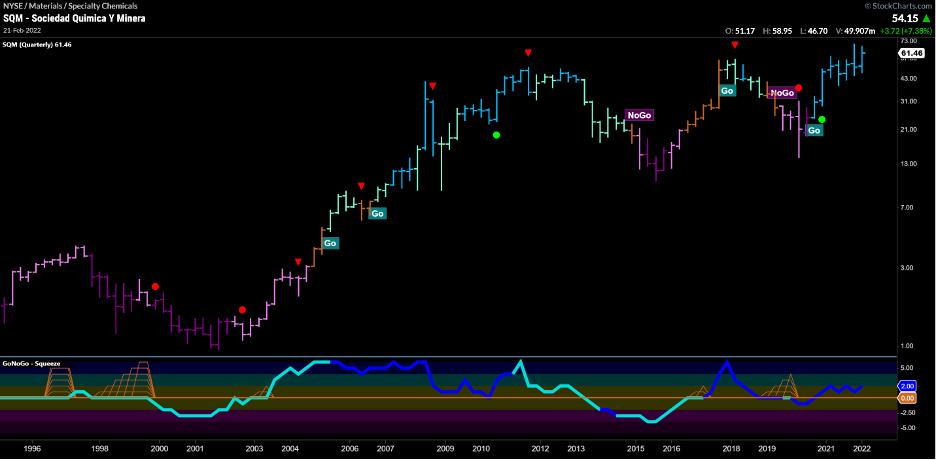
What is fascinating about these shares is that on every timeframe – quarterly, monthly, weekly and daily – the stock is in a "Go" trend. Notably, the quarterly and monthly charts are poised to lock in all-time closing highs. That is bullish.
If you watched the Super Bowl, mainly for the creative genius in the advertisements (as we did), you may have noticed every major auto manufacturer is releasing new electric vehicles. The demand for lithium in each of those batteries could drive price action for lithium miners faster than Arnold could drive that new electric truck!
Emerging Markets (just not China)
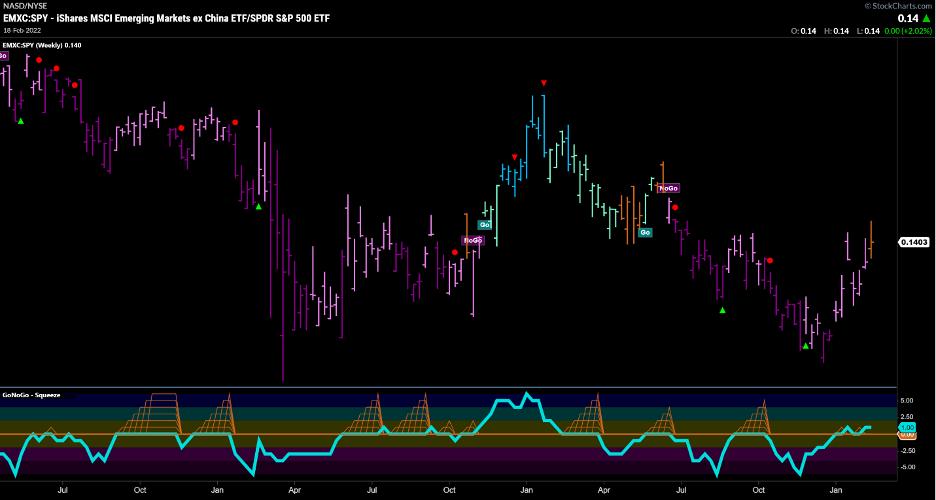
Behavioral economists have studied how investors over-allocate to their local stock market. For Canadians, that's working out great, eh? But American investors have been rewarded so heavily for their home-country bias throughout this cycle that we may have forgotten the wide world of equities on distant shores. As the charts below will show, relative and absolute opportunities exist for trends in foreign equities. Consider this weekly relative ratio chart of Emerging Markets (excluding China) vs the S&P. The significant downtrend since the start of 2021 has made this space undesirable, but, as trend followers, we must see the break of trendline resistance in 2022. GoNoGo Trend has shifted from a weak "NoGo" to neutral amber last week as the GoNoGo Oscillator broke positive for the first time in a year on heavy volume:
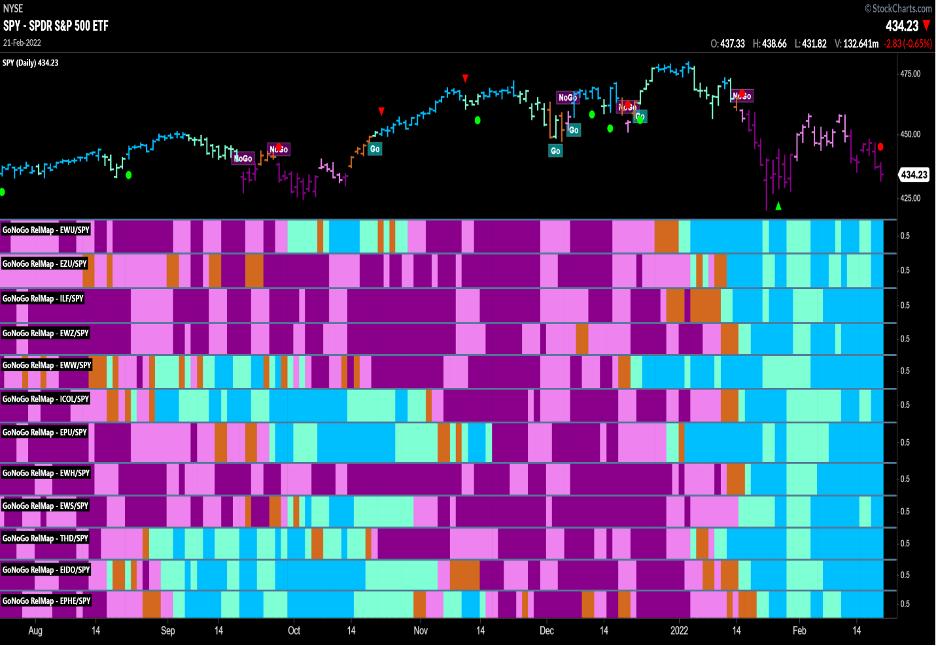
Below is another way to look at relative strength across foreign equity markets. A GoNoGo RelMap of ETFs against the S&P 500 shows that the U.K, the Eurozone, Latin America's top 40, Brasil, Mexico, Colombia, Peru, Hong Kong, Singapore, Thailand, Indonesia and the Philippines are all outperforming the US Equity market on a daily trend basis. Even more importantly, those relative trends have strengthened across the board into the more bullish blue "Go" conditions.
US markets were closed in observance of Presidents Day today, February 21st. Consider an alternative to waking up tomorrow and repeating the cycle of the last two weeks. As trend followers, we want to "fish where the fish are." Right now, both absolute and relative trends suggest that the grass may actually be greener in other pastures.
Better Charts. Better Decisions.
Alex Cole & Tyler Wood