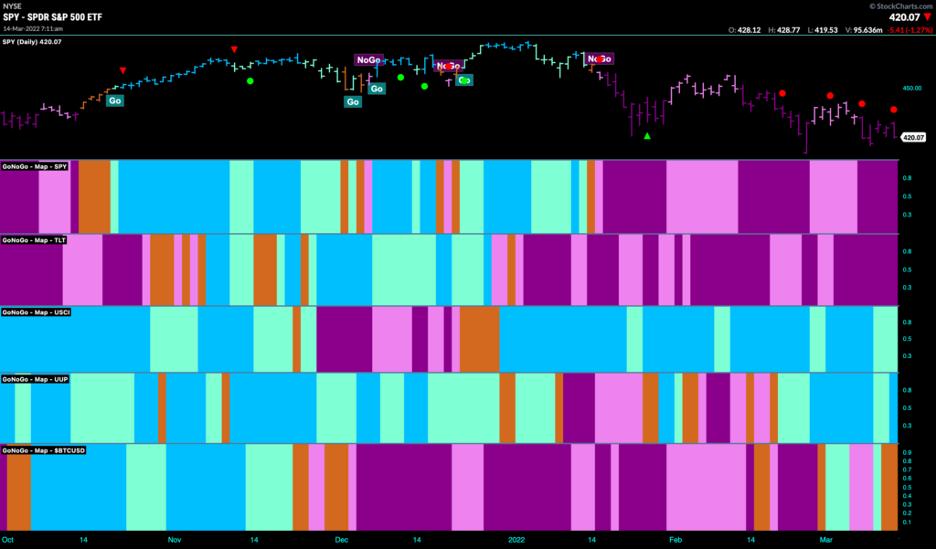
Good morning and welcome to this week's Flight Path. Let's take a look at the below GoNoGo Asset Map for this week. The top panel shows that the trend in U.S. equities has remained a "NoGo" and strengthened this week on purple bars. Up big, down big; this kind of volatility is never a sign of a comfortable market. Treasury bond prices remain in a strong "NoGo" again this week, painting purple bars. Commodities and the dollar remain in "Go" trends this week, and we'll look at some industries and stocks poised to benefit later in this note.
S&P Sinks Toward Prior Lows
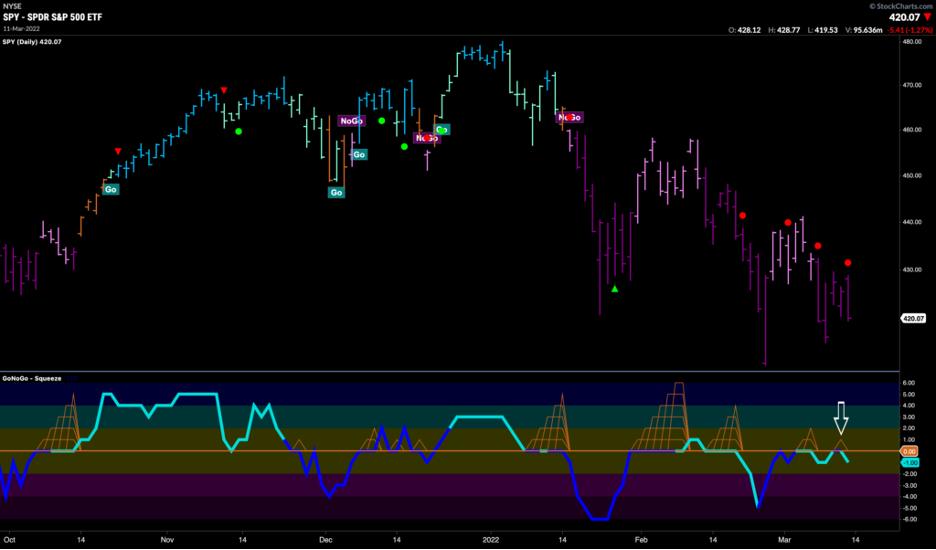
Below is the chart of the $SPY with GoNoGo Trend and GoNoGo Oscillator and Squeeze applied. The "NoGo" trend remains in place and GoNoGo Trend paints a string of purple bars. Since the "NoGo" took hold in mid-January, the GoNoGo Oscillator has stayed primarily below the zero line and this level has acted as resistance. Currently, we are seeing the oscillator butt up against zero and, so far, that level continues to hold as resistance. Each time the oscillator gets turned away, we can look for price to try to move lower. This being the case, with momentum in the direction of the "NoGo", price may soon test the 2/24 low.
Sector Strength
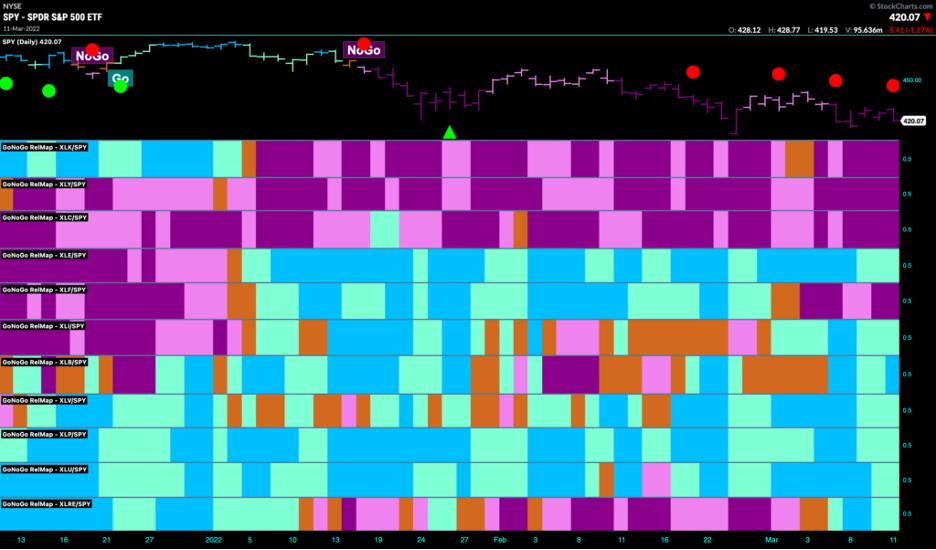
Below is a GoNoGo Sector RelMap. The chart applies the GoNoGo Trend to the relative ratio of each sector ETF to the base ETF, the $SPY. There are seven sectors that are showing relative "Go" trends to end the week. Again, it is the cyclical and defensive sectors that are showing relative outperformance. Of course, as we shall see later, this does not mean that all of these sectors are in pure "Go" trends, but, on a relative basis, it is these sectors that are faring better than the index as a whole. They are certainly faring better than the sectors that we can see from this RelMap are in relative "NoGo" trends. Those sectors remain the same, growth sectors such as technology, discretionary and communications. The financials sector has been hit hard by current events and remains embroiled in a 'NoGo" this week as well.
Materials Not as Miserable as Some
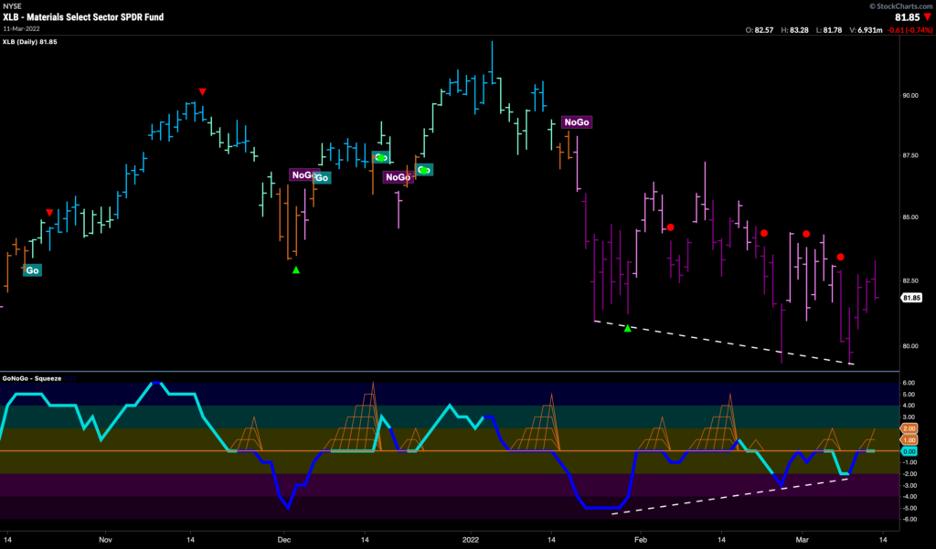
As we mentioned above, it is the cyclical sectors that are in relative "Go" trends. One of these, one that has has strengthened of late and is in a relative "Go" trend is $XLB, is the materials sector. The GoNoGo Chart below shows daily prices with the GoNoGo Trend and GoNoGo Oscillator applied. While the weight of the evidence clearly shows us this sector is in a "NoGo" trend, it is certainly not falling as hard or as fast as the S&P 500 itself. We can see on this chart bullish divergence between price and the oscillator. Price has made a series of lower lows, but the GoNoGo Oscillator hasn't responded in kind, itself making a series of higher lows as it climbs up to the zero line after each trough. Now, testing the zero line from below, it will be interesting to see if it is rejected again, which would indicate that the "NoGo" is strong enough to continue, or if it breaks back into positive territory.
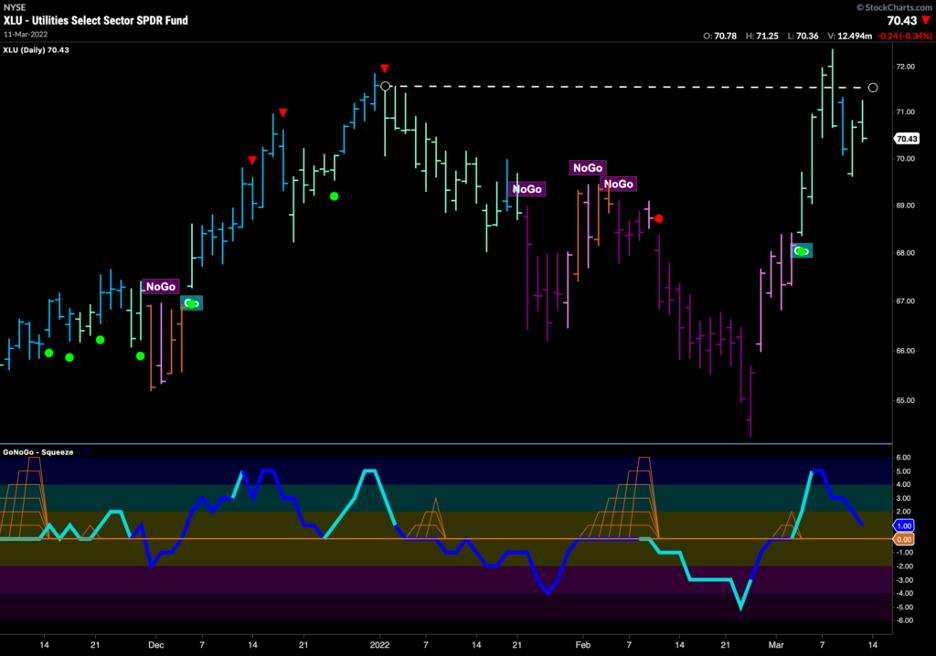
Utilities on the Up
Utilities on the other hand, is a sector that is outperforming on a relative basis and is in a pure "Go" trend all by itself. The GoNoGo Chart below shows that the "Go" returned early March as GoNoGo Oscillator broke above the zero line signaling positive momentum to confirm the identification of a new "Go" trend. This price action sent price roaring back to test the 12/31/21 high. It has fallen away from that level as investors digest gains, but the "Go" trend remains in place painting aqua bars. As GoNoGo Oscillator falls to the the zero line on heavy volume, we will watch to see if it finds support. If the zero level holds, we will look for price to rally again and attempt to set a new high.
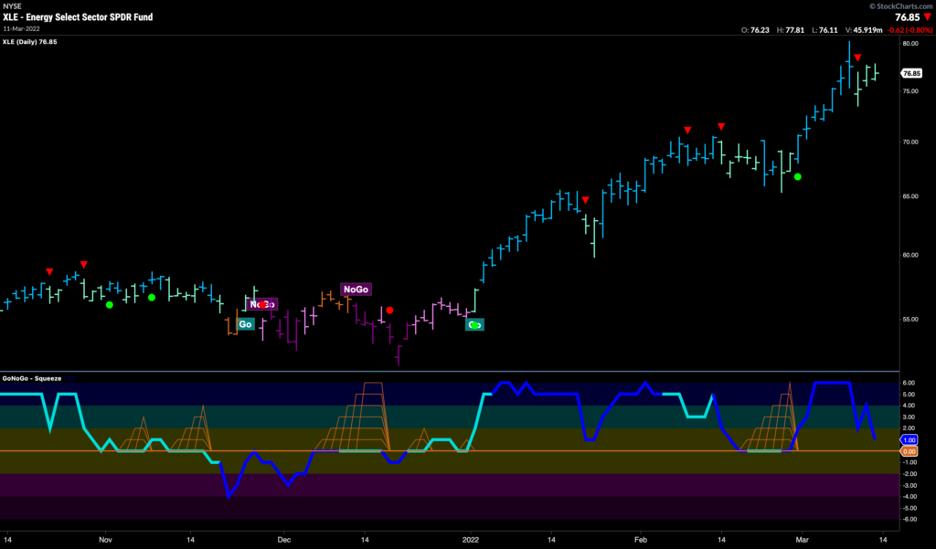
Energy Exceeds Expectations
The daily GoNoGo Chart of the energy sector, $XLE, makes it clear where investors could have been enjoying serious alpha since the beginning of the year. At the risk of sounding like a broken record, energy has been a leader for several months now and this trend continues. Toward the beginning of last week, we saw a Go Countertrend Correction red arrow, which suggests to us that it may be hard for the sector to make new gains in the short term as price may take a pause. The trend is in place, though, and we will watch the GoNoGo Oscillator closely as it approaches zero on heavy volume to see if it finds support. If it does, we will see another Go Trend Continuation green circle appear under the price bar, which would mean the trend is set to continue and we can look for price to attempt a new high.
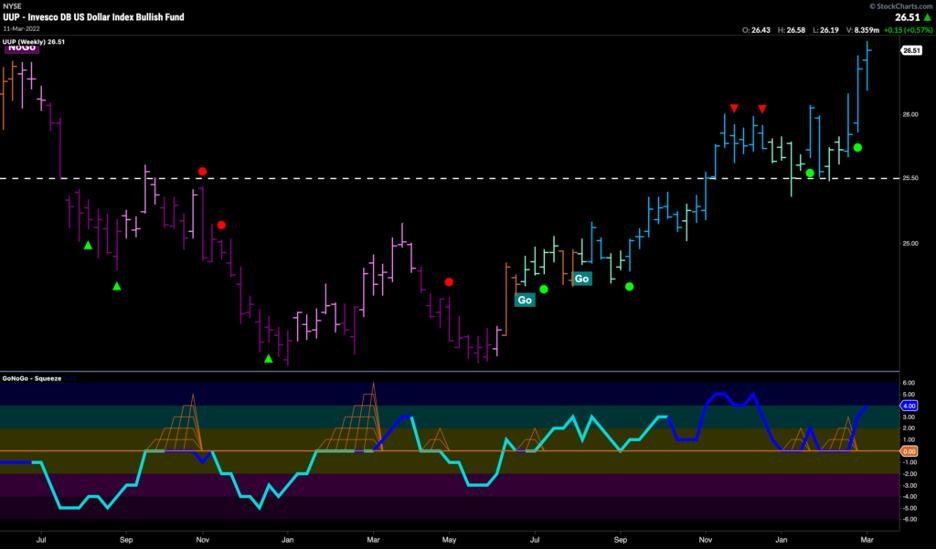
The Almighty Dollar is Back?
Many factors are at play that appear to be creating a tailwind for the greenback as perhaps investors look to the U.S. currency for some safety. Worries about the war in Ukraine, decreasing supply of dollar-priced commodities and impending yearlong rate hikes to tackle growing inflation all help dollar prices.
Below is a weekly GoNoGo Chart of $UUP, where we can clearly see the trend that has emerged since the summer of 2021. After failing to set a lower low in May, GoNoGo Oscillator broke above the zero line for good and GoNoGo Trend cycled through amber "Go Fish" bars before consistently painting "Go" bars as the trend took hold. We have seen price burst through resistance and then retest it; now, with the oscillator being supported by the zero line on heavy volume, GoNoGo Trend is painting strong blue bars.
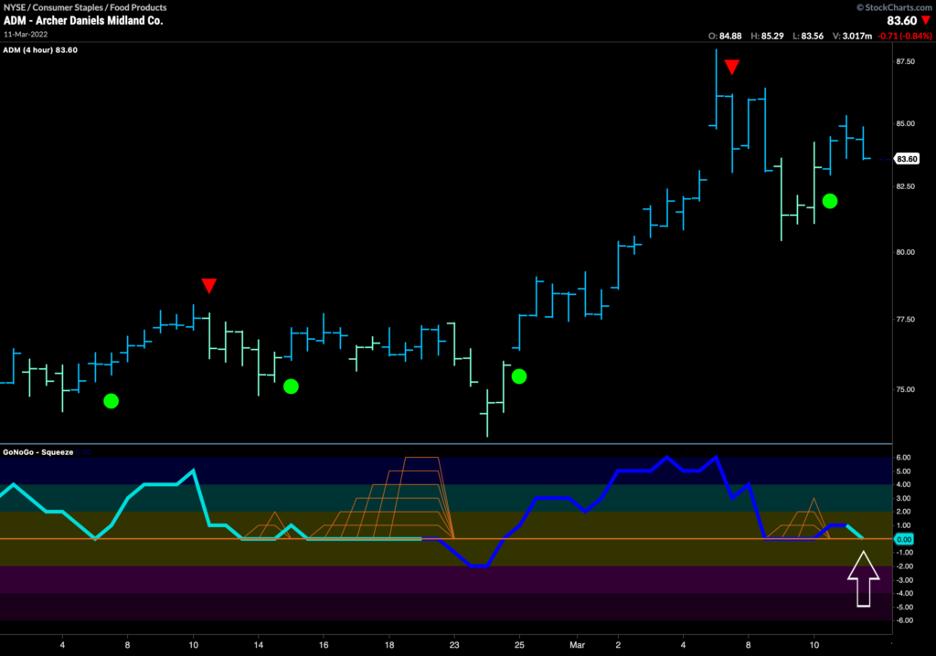
Archer Daniels Set for More Grains (Gains)?
Let's take a look at $ADM, a company that is perhaps positioned well to take advantage of several factors that may drive it higher. We saw at the outset that defensive sectors are outperforming the base index and that commodities and the dollar remain in "Go" trends. A defensive stock in the food industry, we can look at the GoNoGo Chart of Archer Daniels Midland Co. below.
The daily chart would show the strong "Go" trend that the stock is in, but we can go to a 4hr chart (below) to search for a possible opportunity to enter the trend. We can see that we have recently seen a Go Trend Continuation green circle and that GoNoGo Oscillator is once again testing the zero line from above where we will look to see if it finds support. If it does, we will see another Go Trend Continuation icon under the price bar and can look for price to make an attempt at a new high above $87.50.
Better Charts. Better Decisions.
Alex Cole & Tyler Wood