As the week ends, let's look at some of the thematic charts from a GoNoGo perspective.
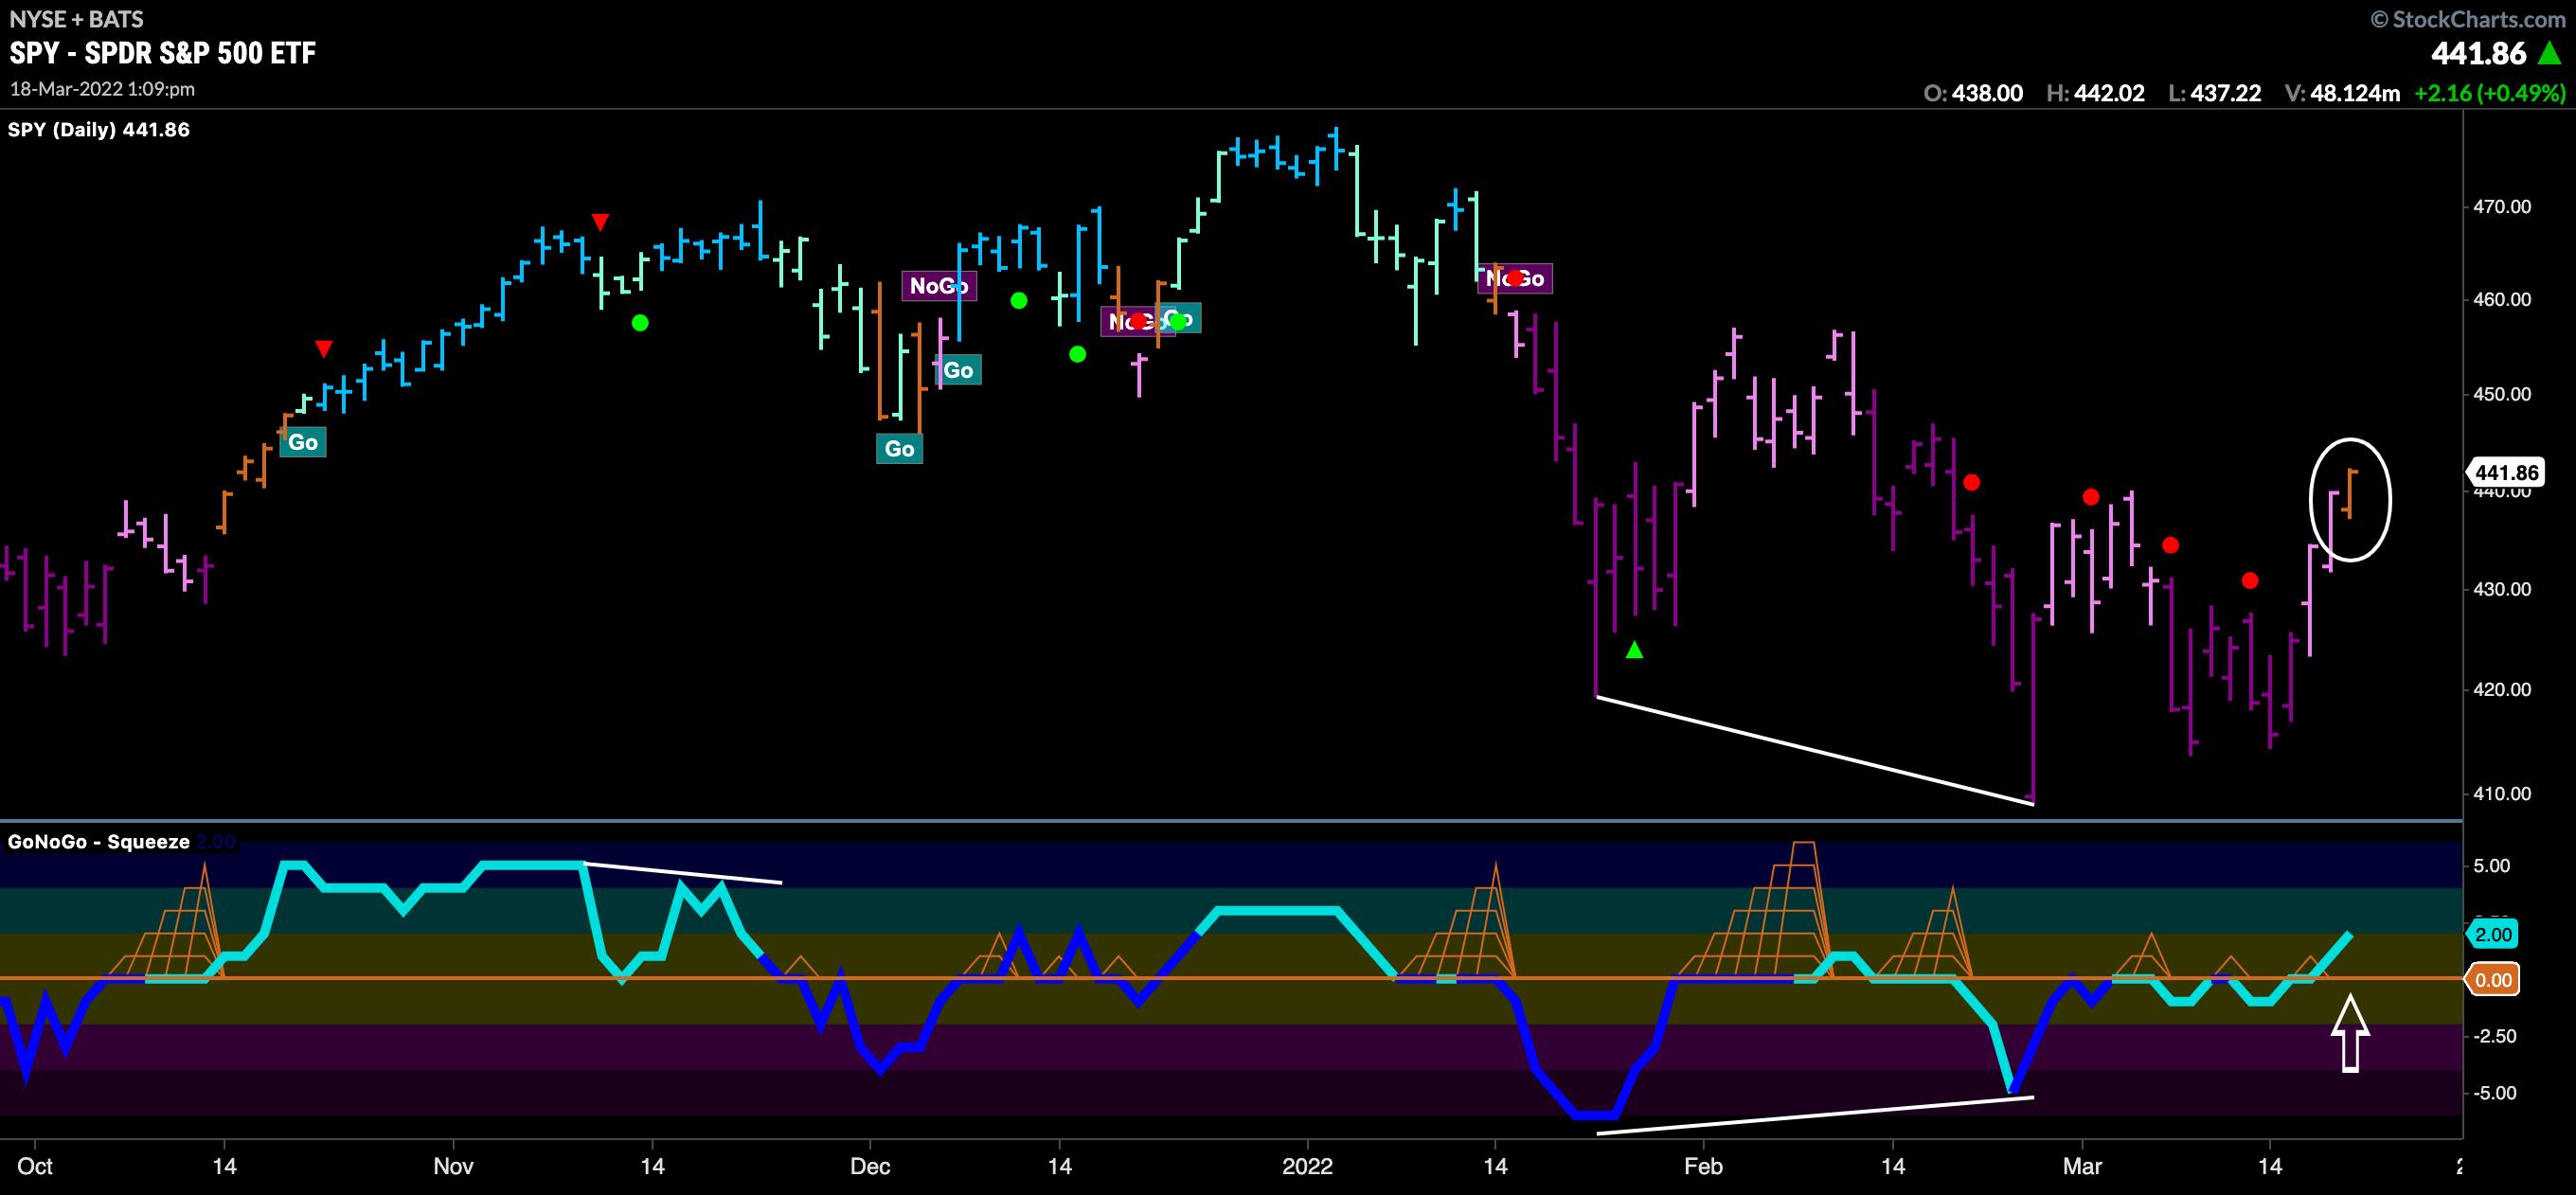
Below is the GoNoGo Chart of $SPY. We have seen a strong rally that started on Wednesday as prices have climbed higher. We were watching the zero line on the oscillator closely to see whether it would act as resistance. When a trend is strong, the zero line acts as an objective level of support/resistance. We see that (at the time of writing, just after 1pm ET 3/18/22) that GoNoGo Oscillator has crossed into positive territory; we are noticing an amber "Go Fish" bar, suggesting that not enough trend conditions have been met to continue to paint "NoGo" bars. We want to see the oscillator remain above zero to show that momentum is positive in order to expect a new "Go" trend to emerge in price.
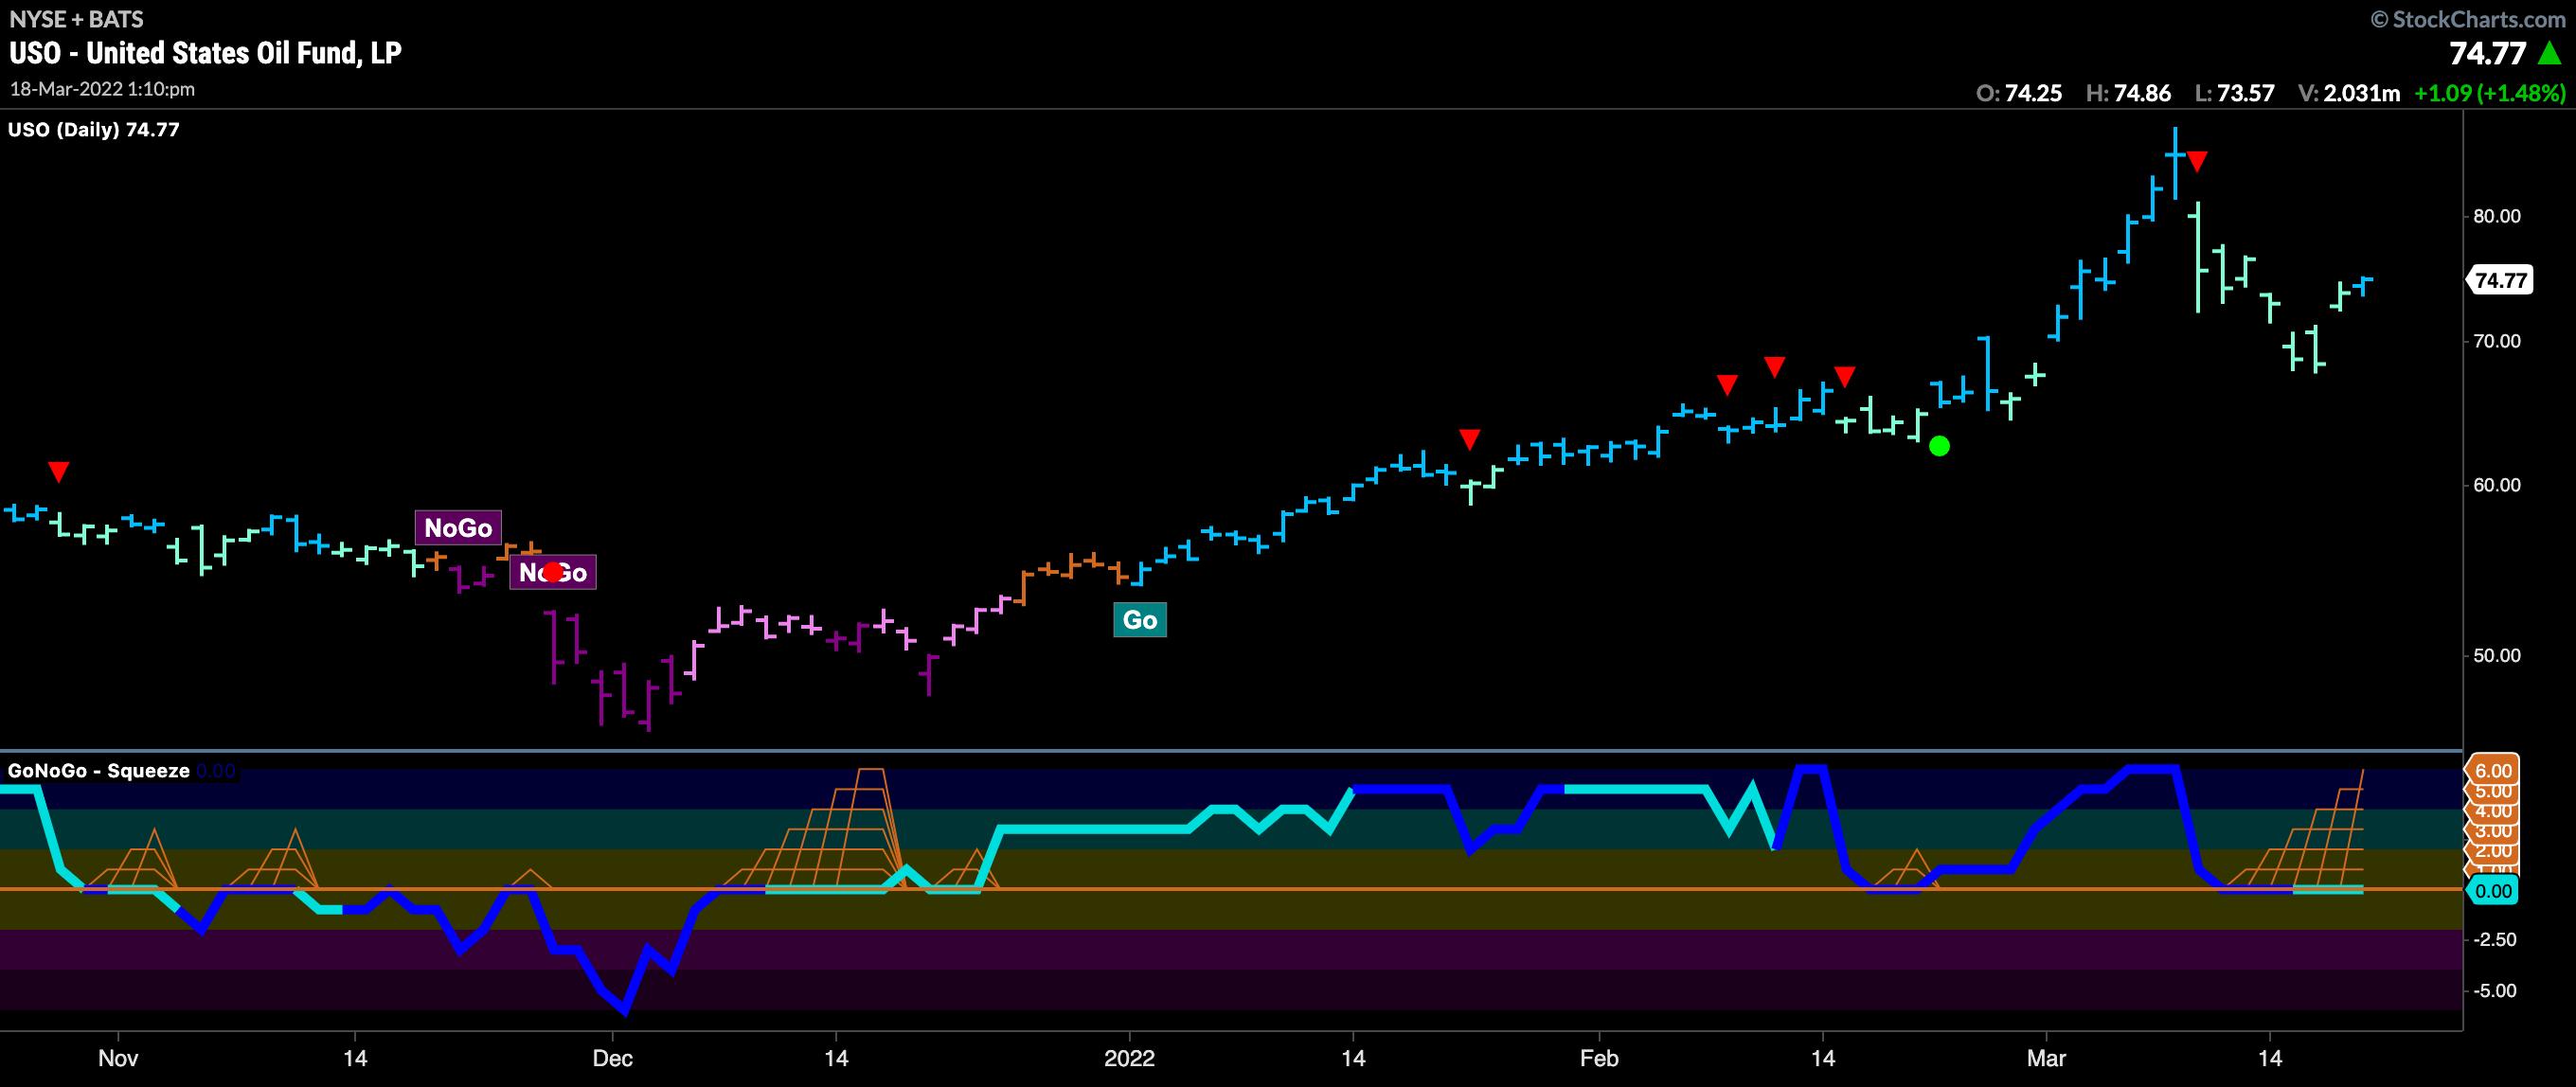
Oil has been champion of the markets since the start of the year, but we saw a significant pullback over the last two weeks. The chart below shows the GoNoGo Chart of $USO, the United States Oil Fund. The correction has caused the GoNoGo Oscillator to fall to the zero line, where it has remained. The GoNoGo Squeeze sees its grid climbing to a max as the oscillator is unable find directional momentum. If the GoNoGo Oscillator can continue to find support at zero and rally into positive territory, then we will see a Go Trend Continuation green circle appear under price, indicating that the "Go" trend is likely to persist and potentially attack the prior high.
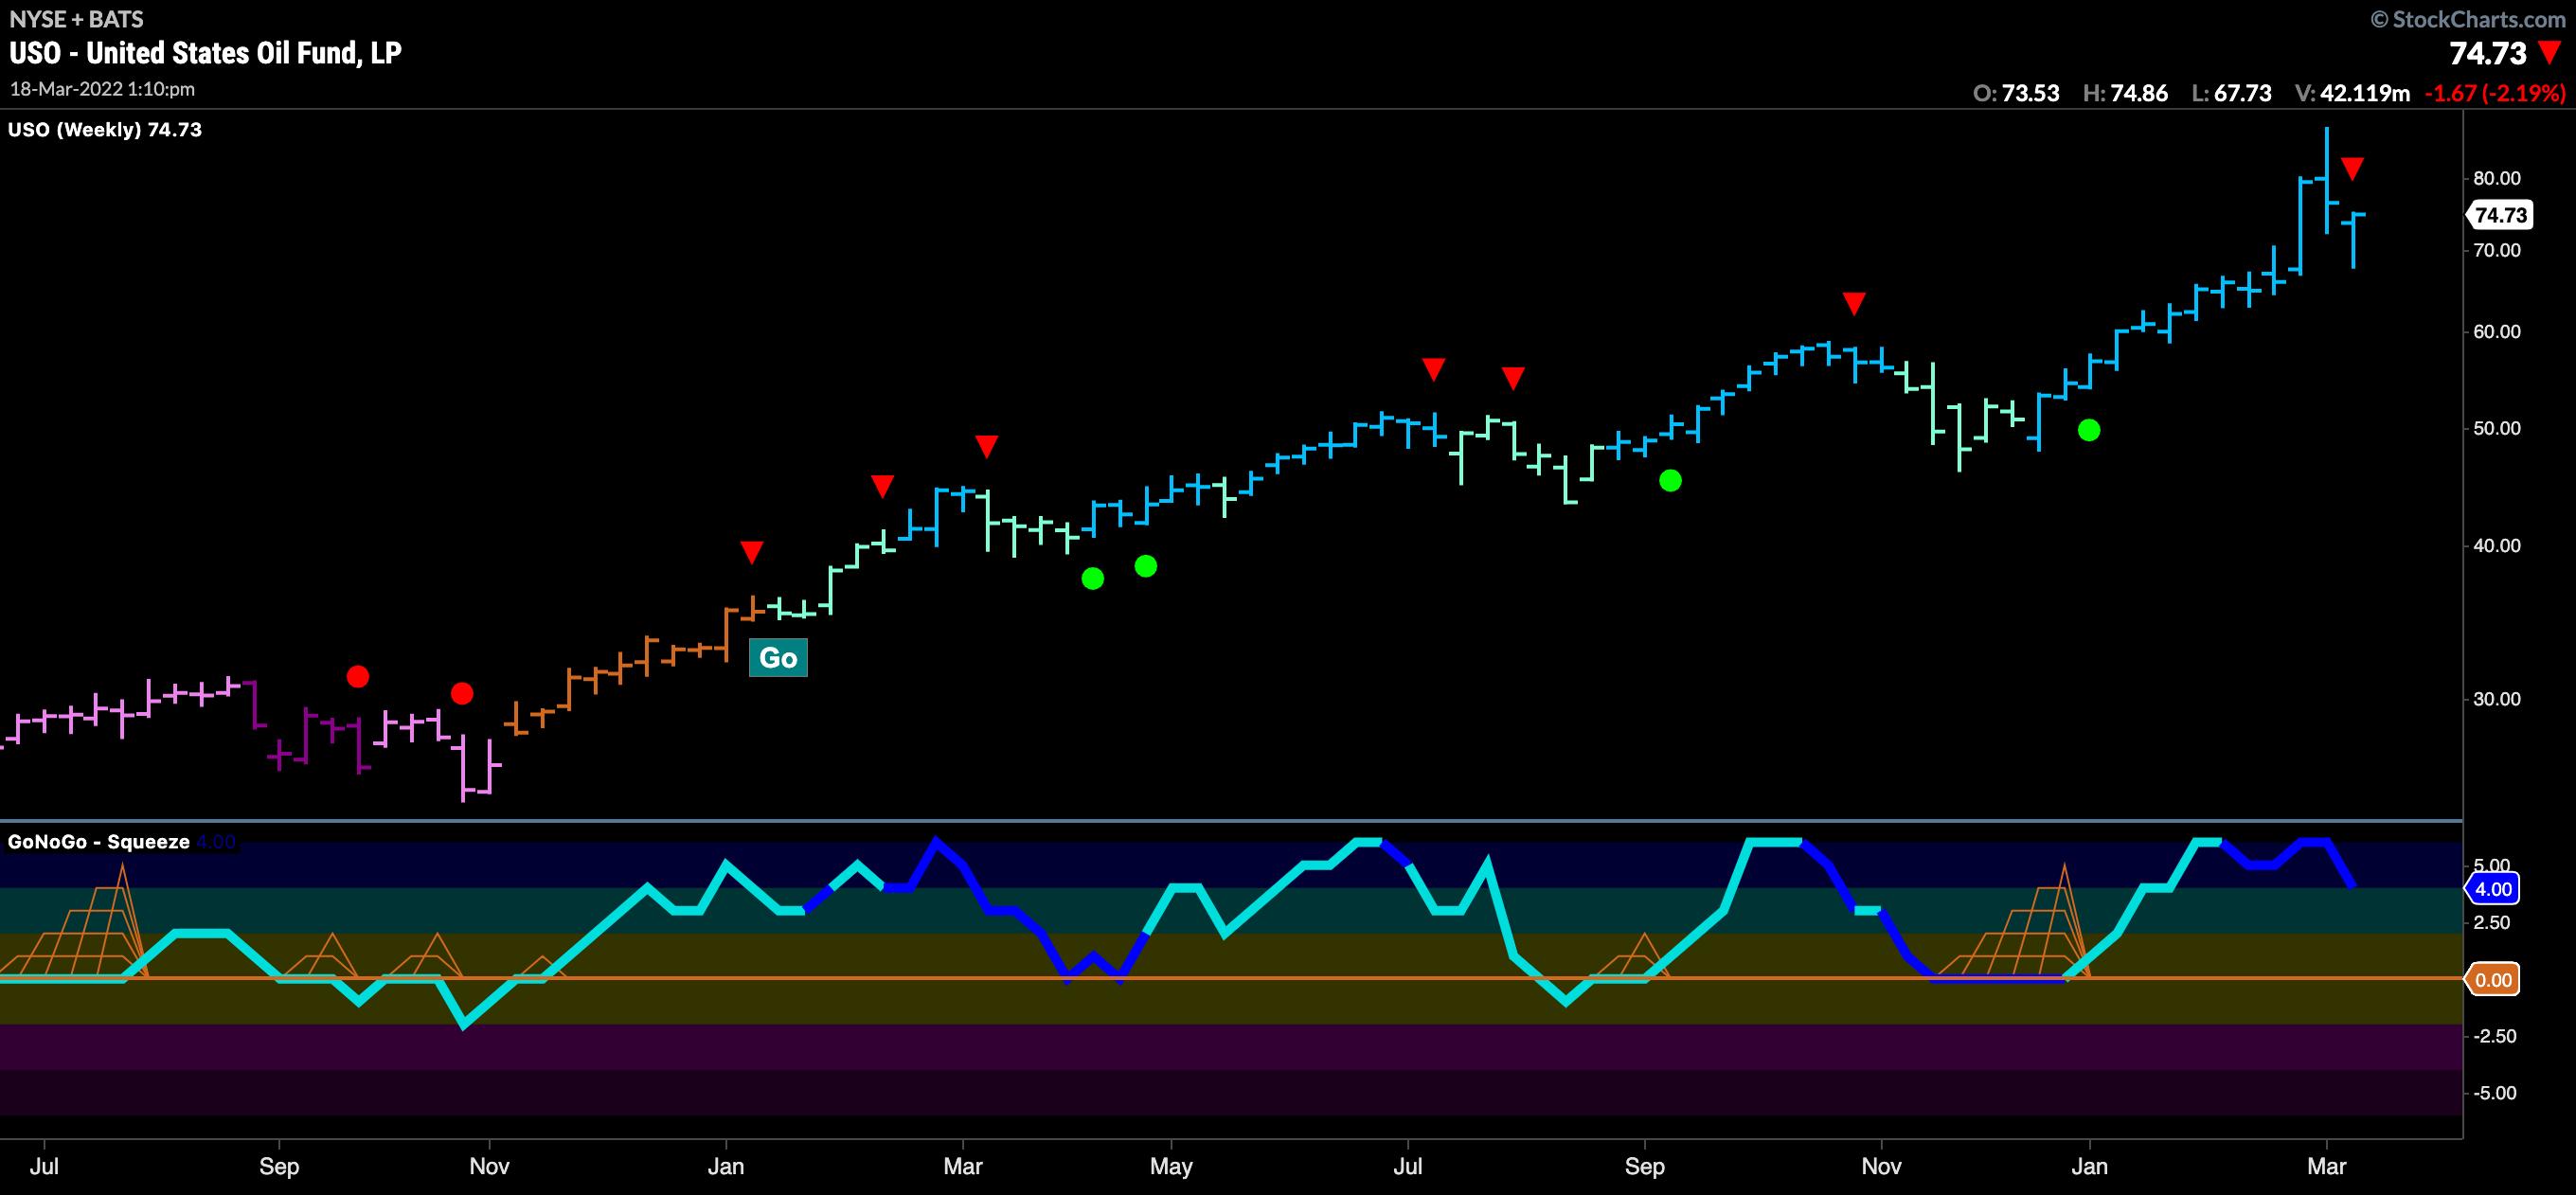
Looking at a GoNoGo Chart of $USO with weekly bars, we can see that there hasn't been much to threaten the larger "Go" trend. The GoNoGo Trend shows uninterrupted "Go" bars since January of 2021 and the GoNoGo Oscillator has consistently found support at the zero line each time momentum has returned in the direction of the "Go" trend. Given the trend is in place, perhaps we can look at the daily above as a "buy the dip" opportunity should the green trend continuation icon appear.
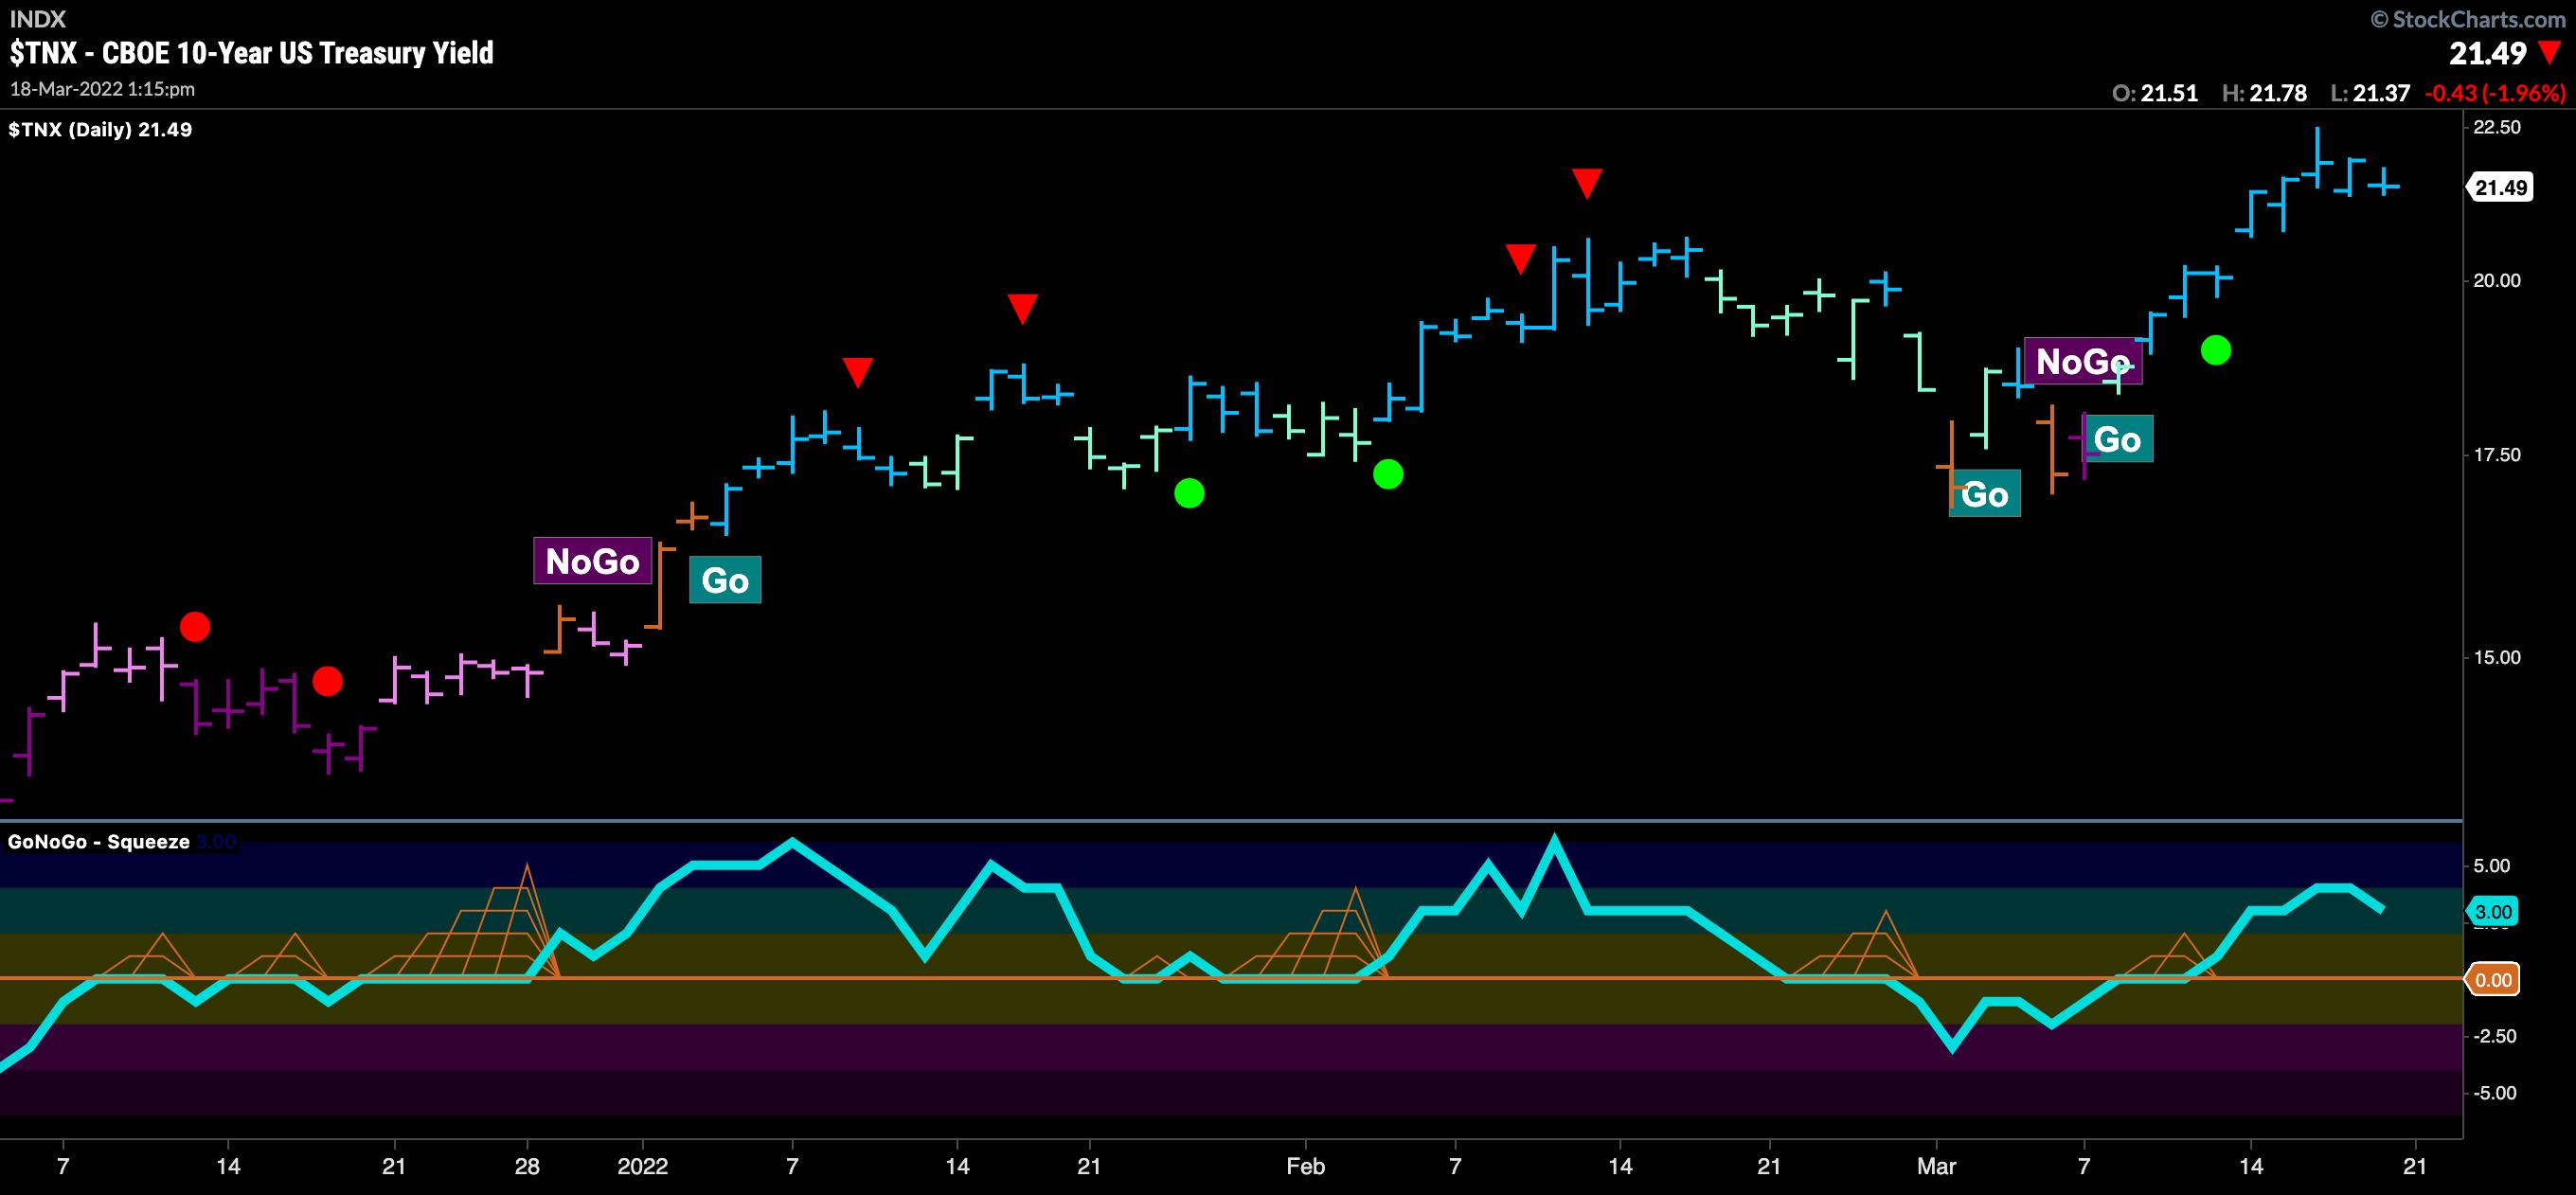
We have also seen a strong move in rates continue this week, with a string of uninterrupted bright blue "Go" bars as prices crept up over 2.2% on Wednesday to set a new higher high. The GoNoGo Oscillator shows that momentum is positive; prices reflect the expected behavior of the Fed as investors look toward consecutive rate hikes in 2022.
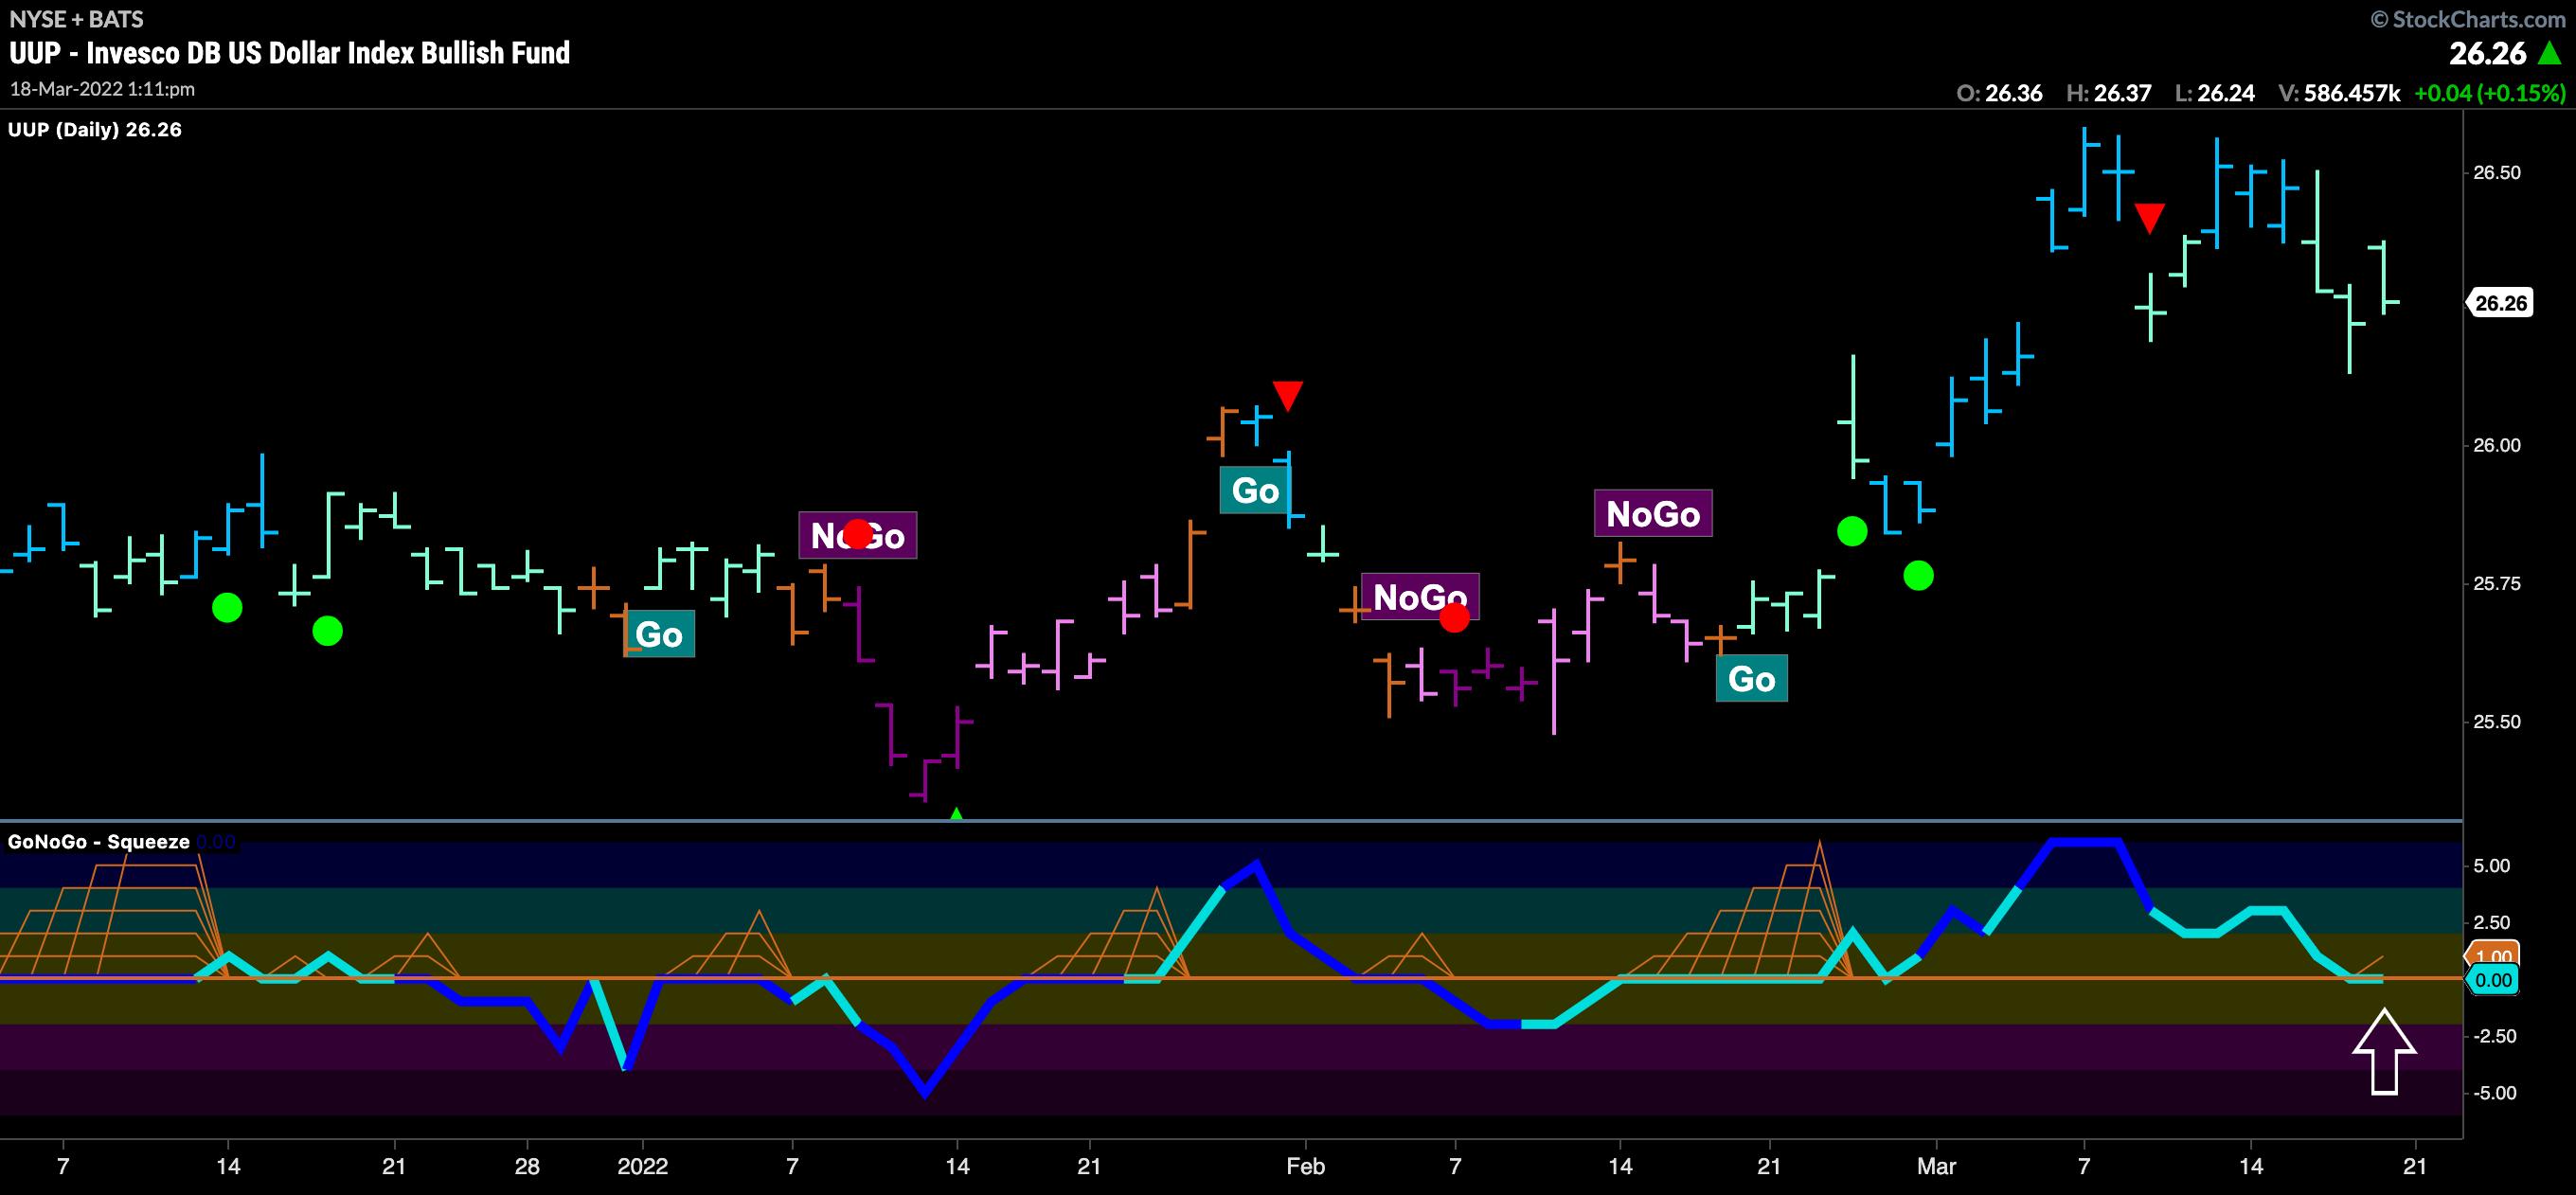
Interestingly, the Go trend in the dollar persists so far, even in the face of a rising rate environment. Below, we can see the GoNoGo Chart of $UUP, the Invesco Dollar Index Bullish fund. The GoNoGo Trend shows weaker aqua "Go" bars in the latter part of the week; this price activity has pushed GoNoGo Oscillator to fall to the zero line. This is now an important inflection point, as we know that, for the "Go" trend to remain in place and move higher, the GoNoGo Oscillator should not break support at zero and fall into negative territory. If the GoNoGo Oscillator fails to hold the zero line, we could see the greenback struggle to hold onto its "Go" trend.
Watch the latest edition of StockCharts TV's GoNoGo Charts show with Alex and Tyler!
Better Charts. Better Decisions.
Alex Cole & Tyler Wood