Equities are maintaining their "Go" trend status this week, but there could be weakness ahead. Treasury bonds and commodities are struggling while the US dollar finds its feet in a new trend.
Equities Continue To Pull Back From Recent High
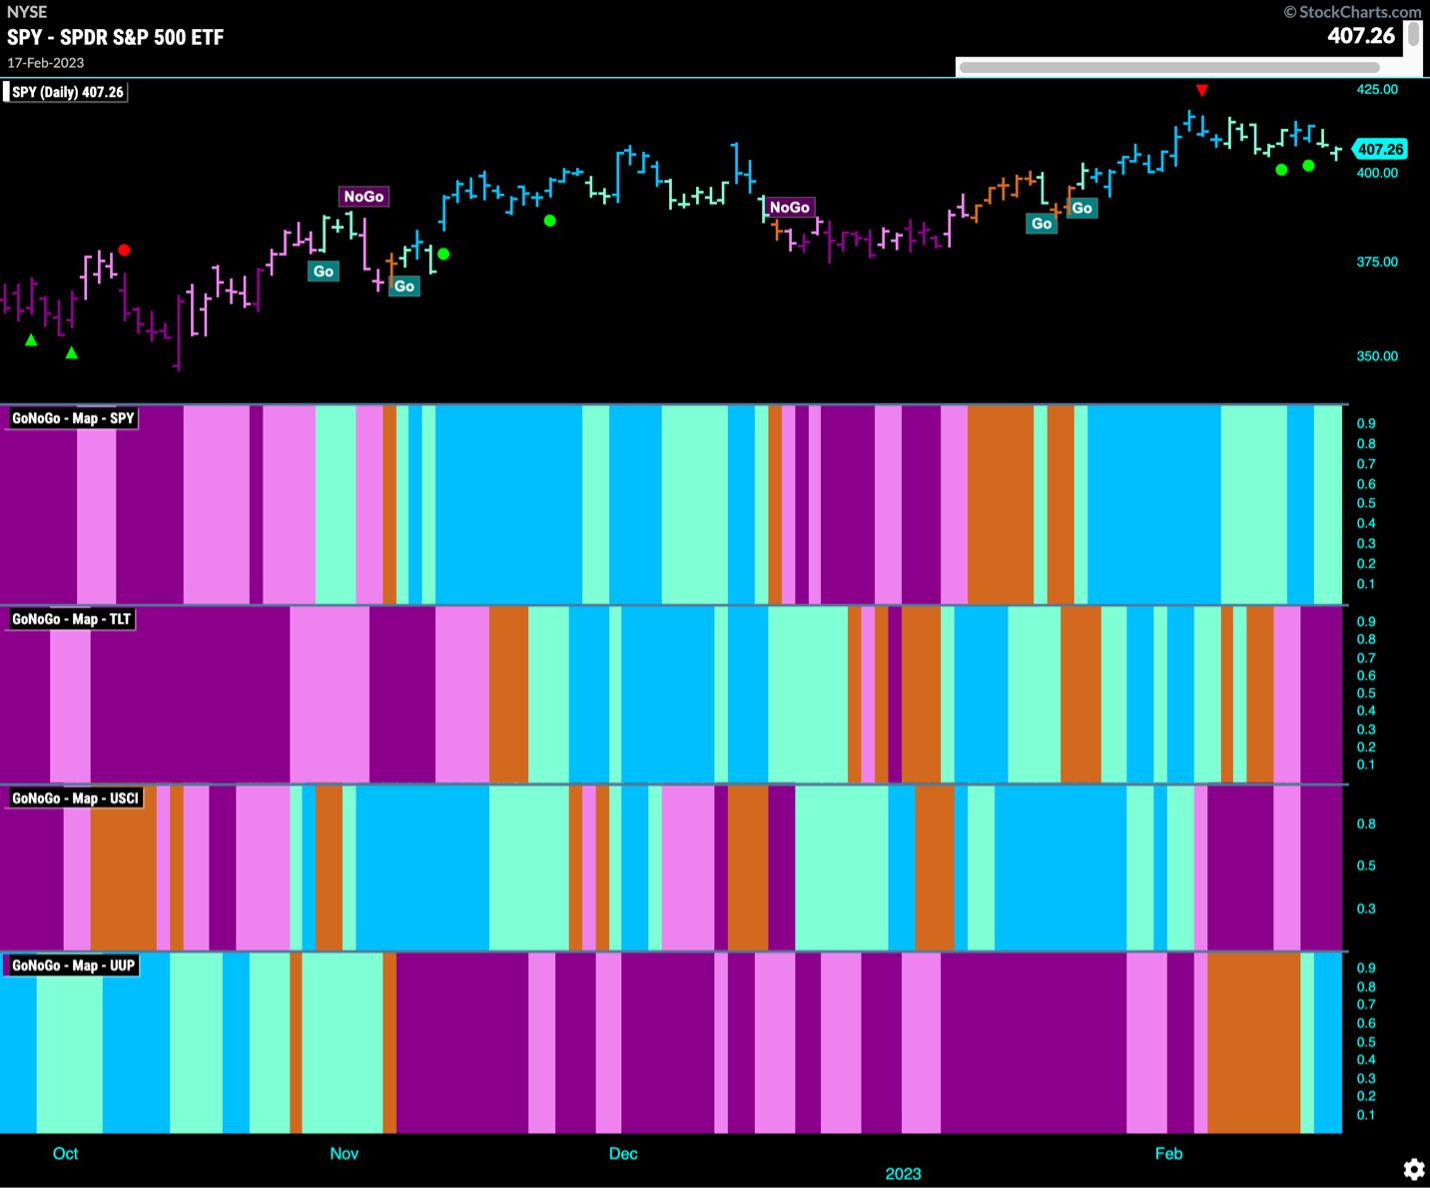
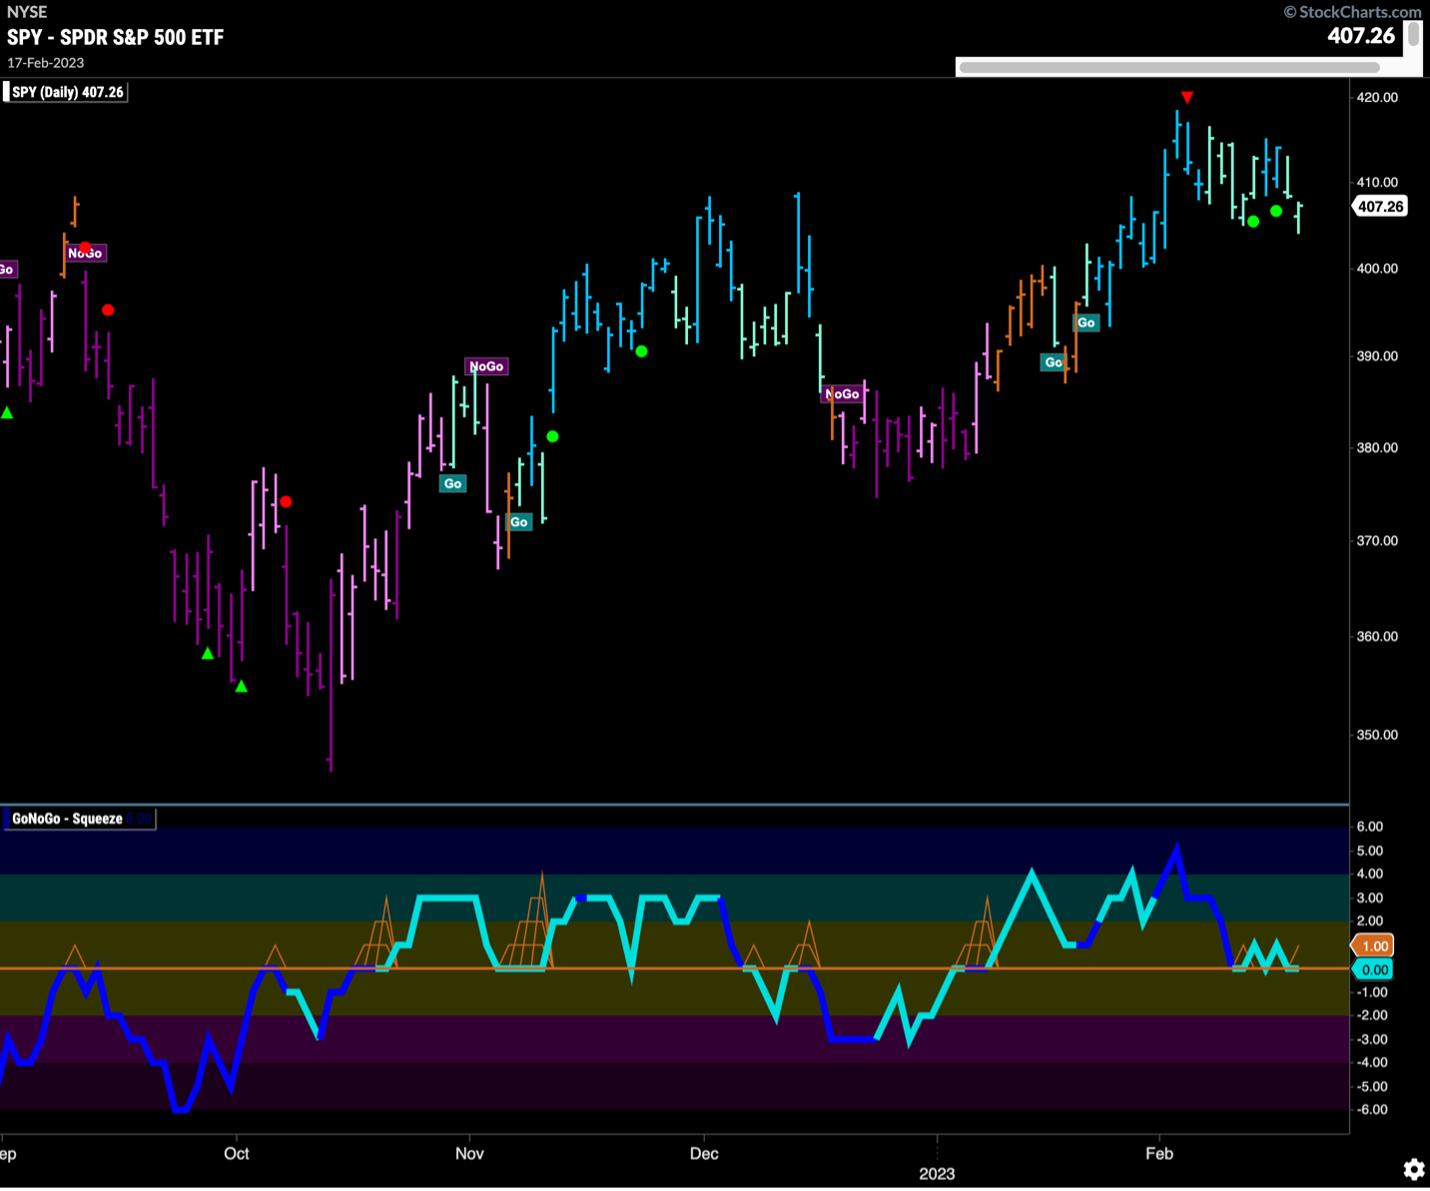
Looking at the chart of iShares S&P 500 ETF (SPY), the GoNoGo Trend shows that the "Go" trend remains. However, prices have fallen into paler aqua bars at week's end. SPY is testing support from November highs. The question is if the correction will stop here.
The GoNoGo Oscillator is once again at the zero line, and if the "Go" trend is to continue, we'll need to see the oscillator find support at the zero level.
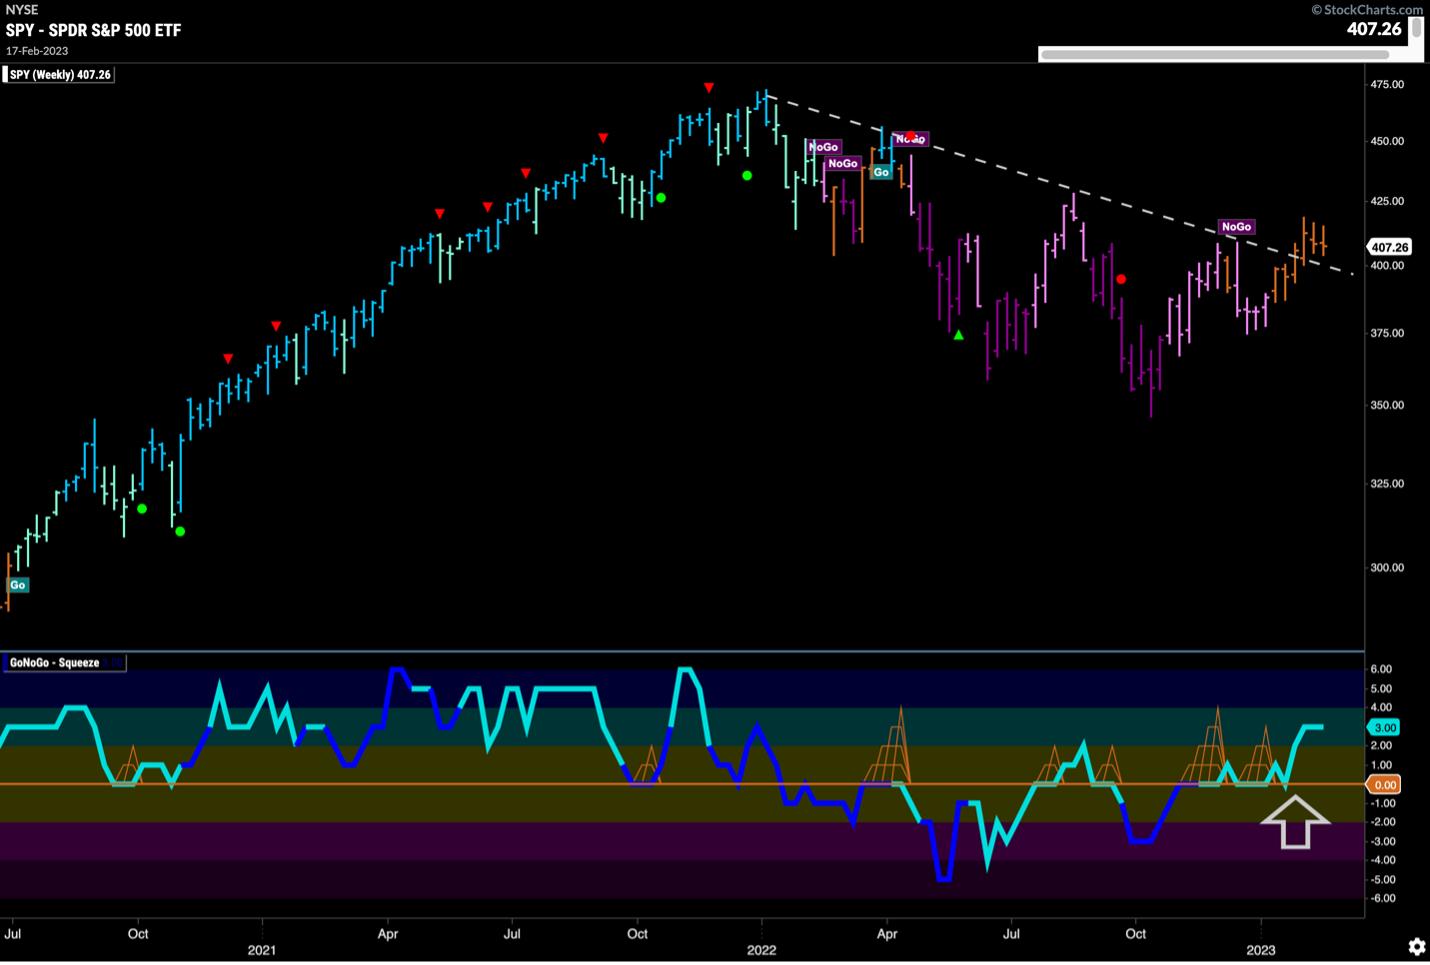
The longer-term weekly SPY chart shows another amber "Go Fish" bar (see chart below). This has been a string of uncertainty, as price is able to climb above the downward sloping trendline and consolidate above. The GoNoGo Oscillator remains in positive territory, but not overbought after rallying off the zero line a few weeks ago.
Treasury Rates Back in "Go" Trend
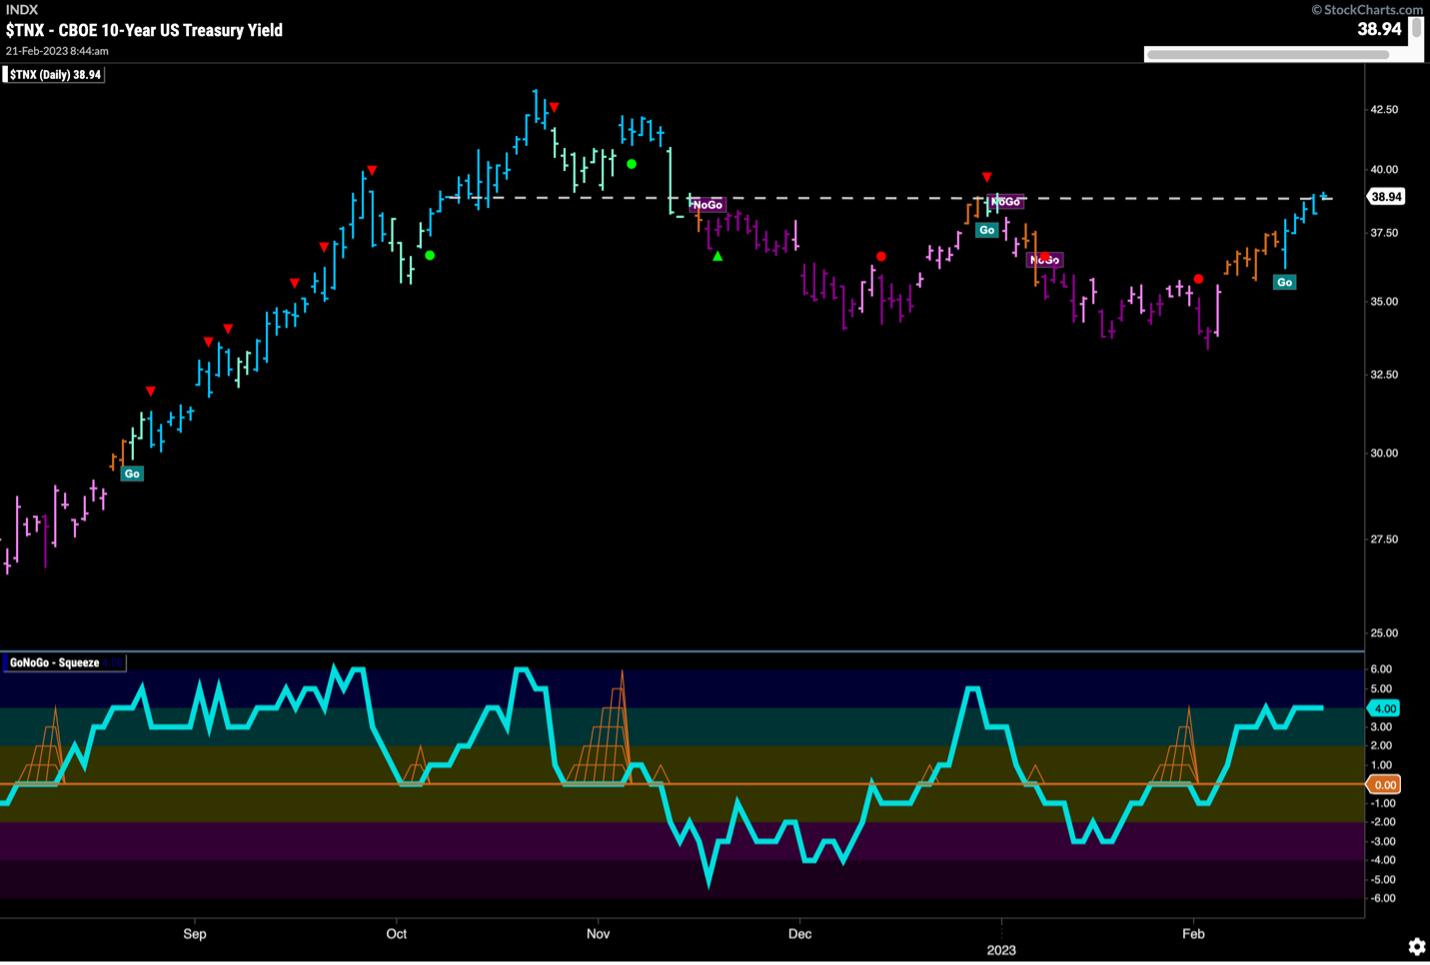
Treasury rates continued to rally, and the GoNoGo Trend was able to paint strong blue "Go" bars this week as price rises to test resistance from prior high (see chart of 10 Year US Treasury Yield below). We will be noting whether this stops rates in its tracks or if it'll set a new high, as the GoNoGo Oscillator shows positive momentum.
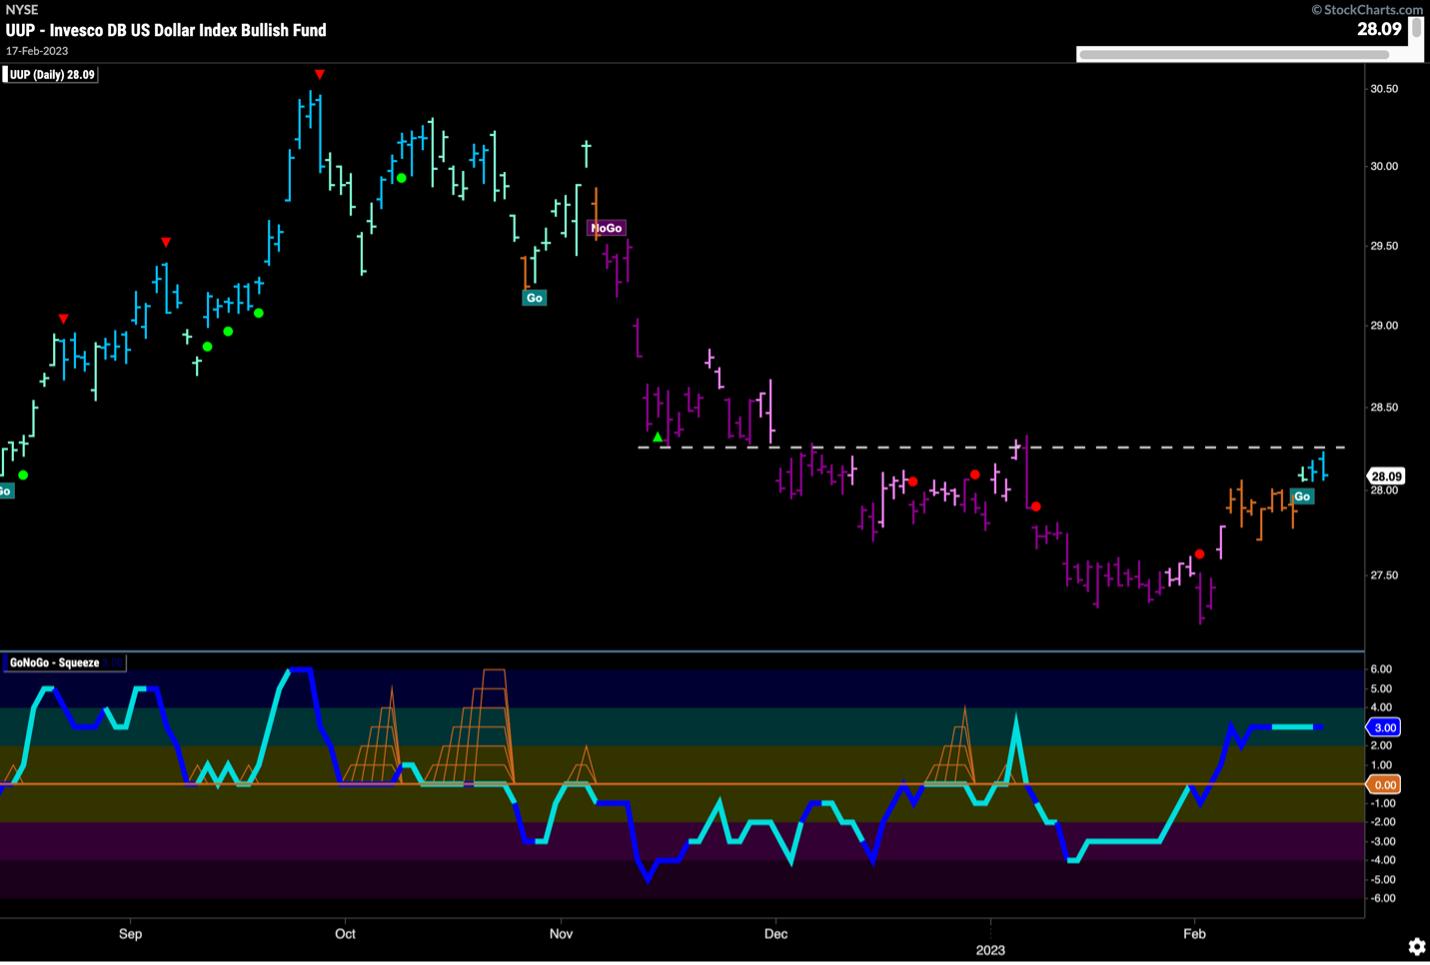
US Dollar Enters "Go" Trend
Almost in lockstep with treasury rates, the US dollar is entering a "Go" trend this week after a period of uncertainty. There's some overhead resistance that you can see in the chart below in the form of the horizontal line. The GoNoGo Oscillator is in positive territory, but not overbought. Volume is heavy. Don't be surprised to see a little struggle here, but, if price moves above resistance, it could signal further gains for the greenback.
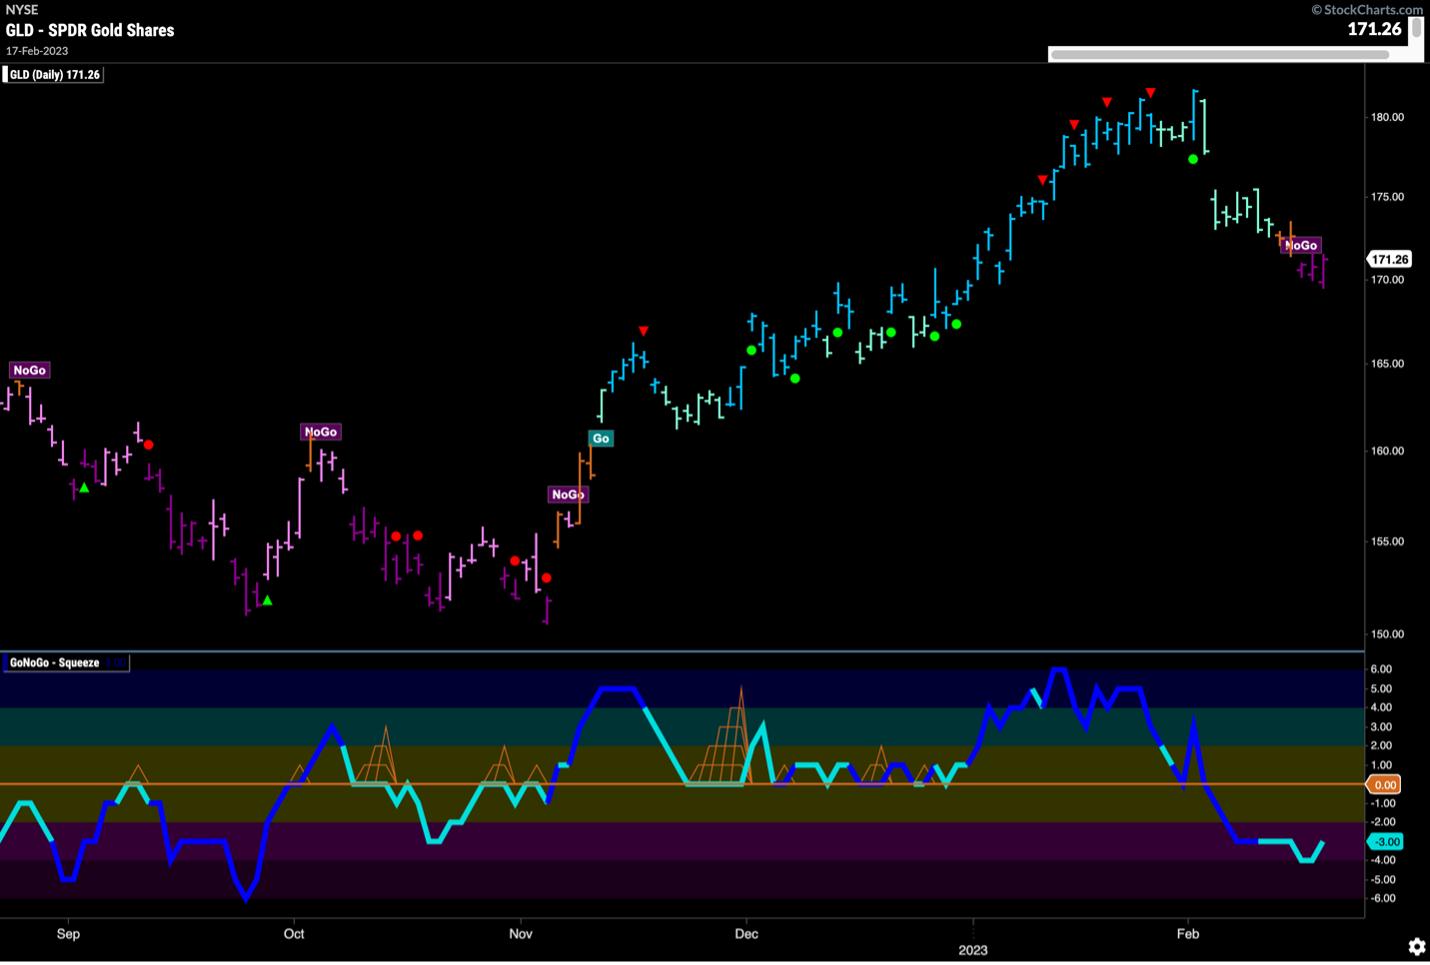
Gold Turns Tail and Enters "NoGo"
Gold prices moved lower this week, and GoNoGo Trend painted strong purple "NoGo" bars. This trend change came a few weeks ago after GoNoGo Oscillator broke below the zero line on heavy volume. Currently, the GoNoGo Oscillator shows that momentum is in negative territory, but not yet oversold. With no obvious support at these levels, $GLD could fall a little further (see GLD chart below).
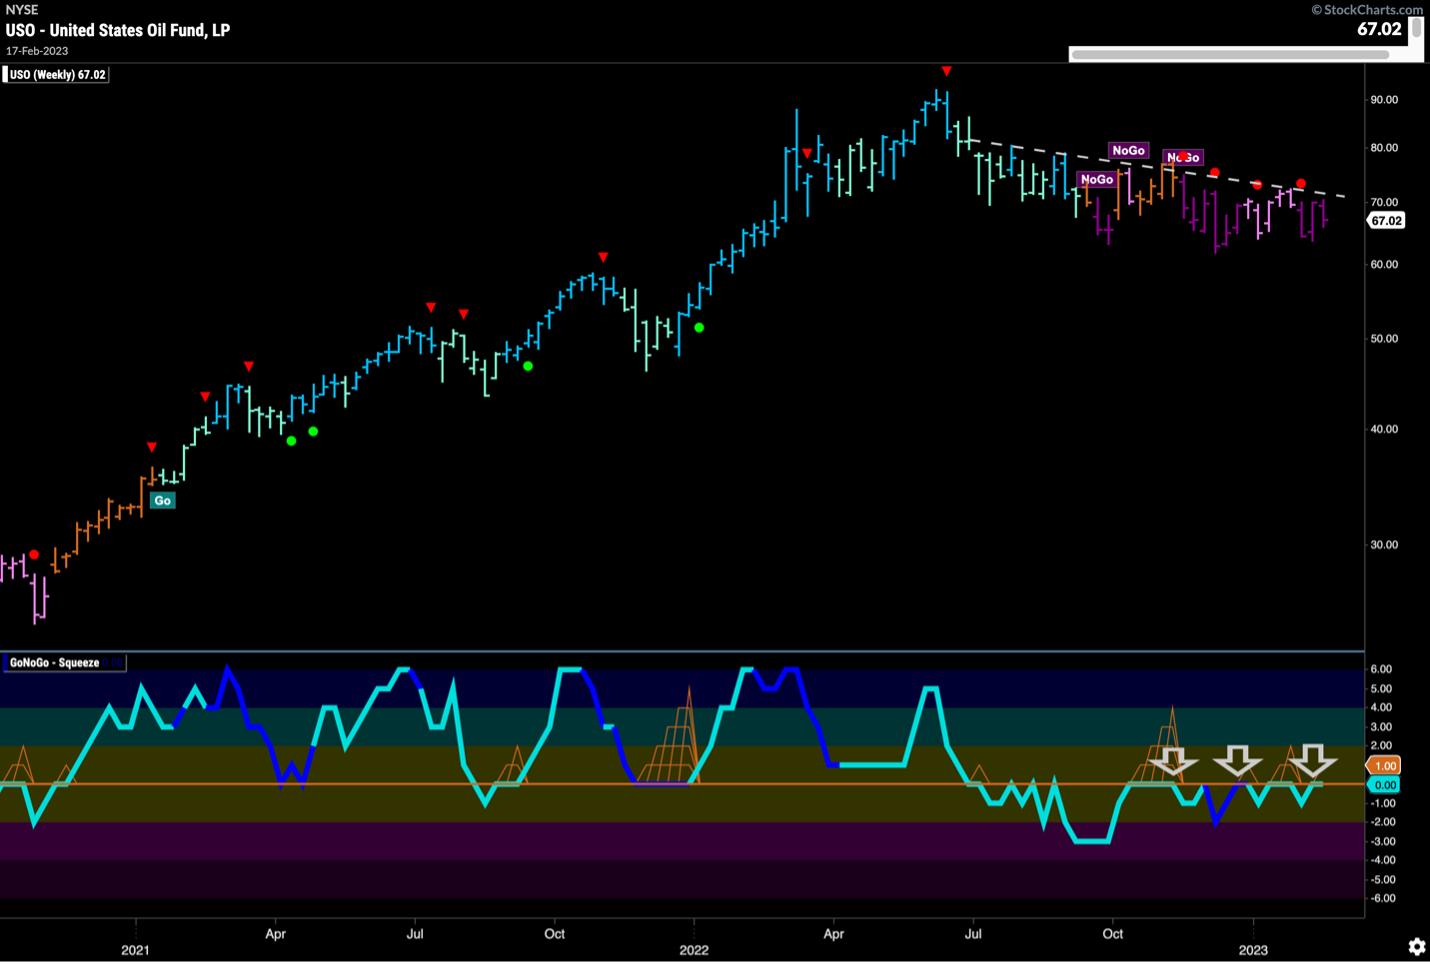
Oil Slowly Grinds Lower
The weekly chart of United States Oil Fund (USO) shows that all the choppy movement on the daily chart hasn't done much to change the larger time frame trend, which remains a "NoGo," and prices are moving lower slowly respecting the downward-sloping trend line. The GoNoGo Oscillator has had difficulty getting far away from the zero line, but hasn't yet been able to break into positive territory. We will watch to see if it gets rejected again at this level.
The Bottom Line
The stock market is at a critical juncture, which makes it even more important to keep an eye on intermarket relationships. A change in trend could be an early indication of which way equities could move.
Don't miss important trend changes in the different markets. Stay on top of the technical picture by installing the GoNoGo Plug-In.


