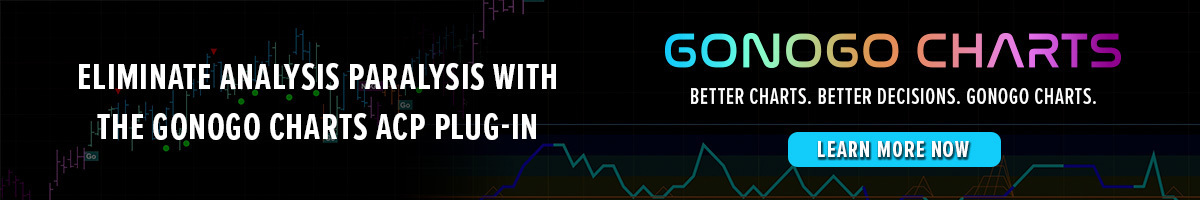
How is the overall stock market looking as of the end of last week? Let's take a look at the GoNoGo Asset map below.
Equities remain in the "Go" trend as we start the new week. Treasury bond prices are likewise in a strong "Go," and commodities have entered a weak aqua "Go" trend. The dollar remains embroiled in a strong "NoGo".
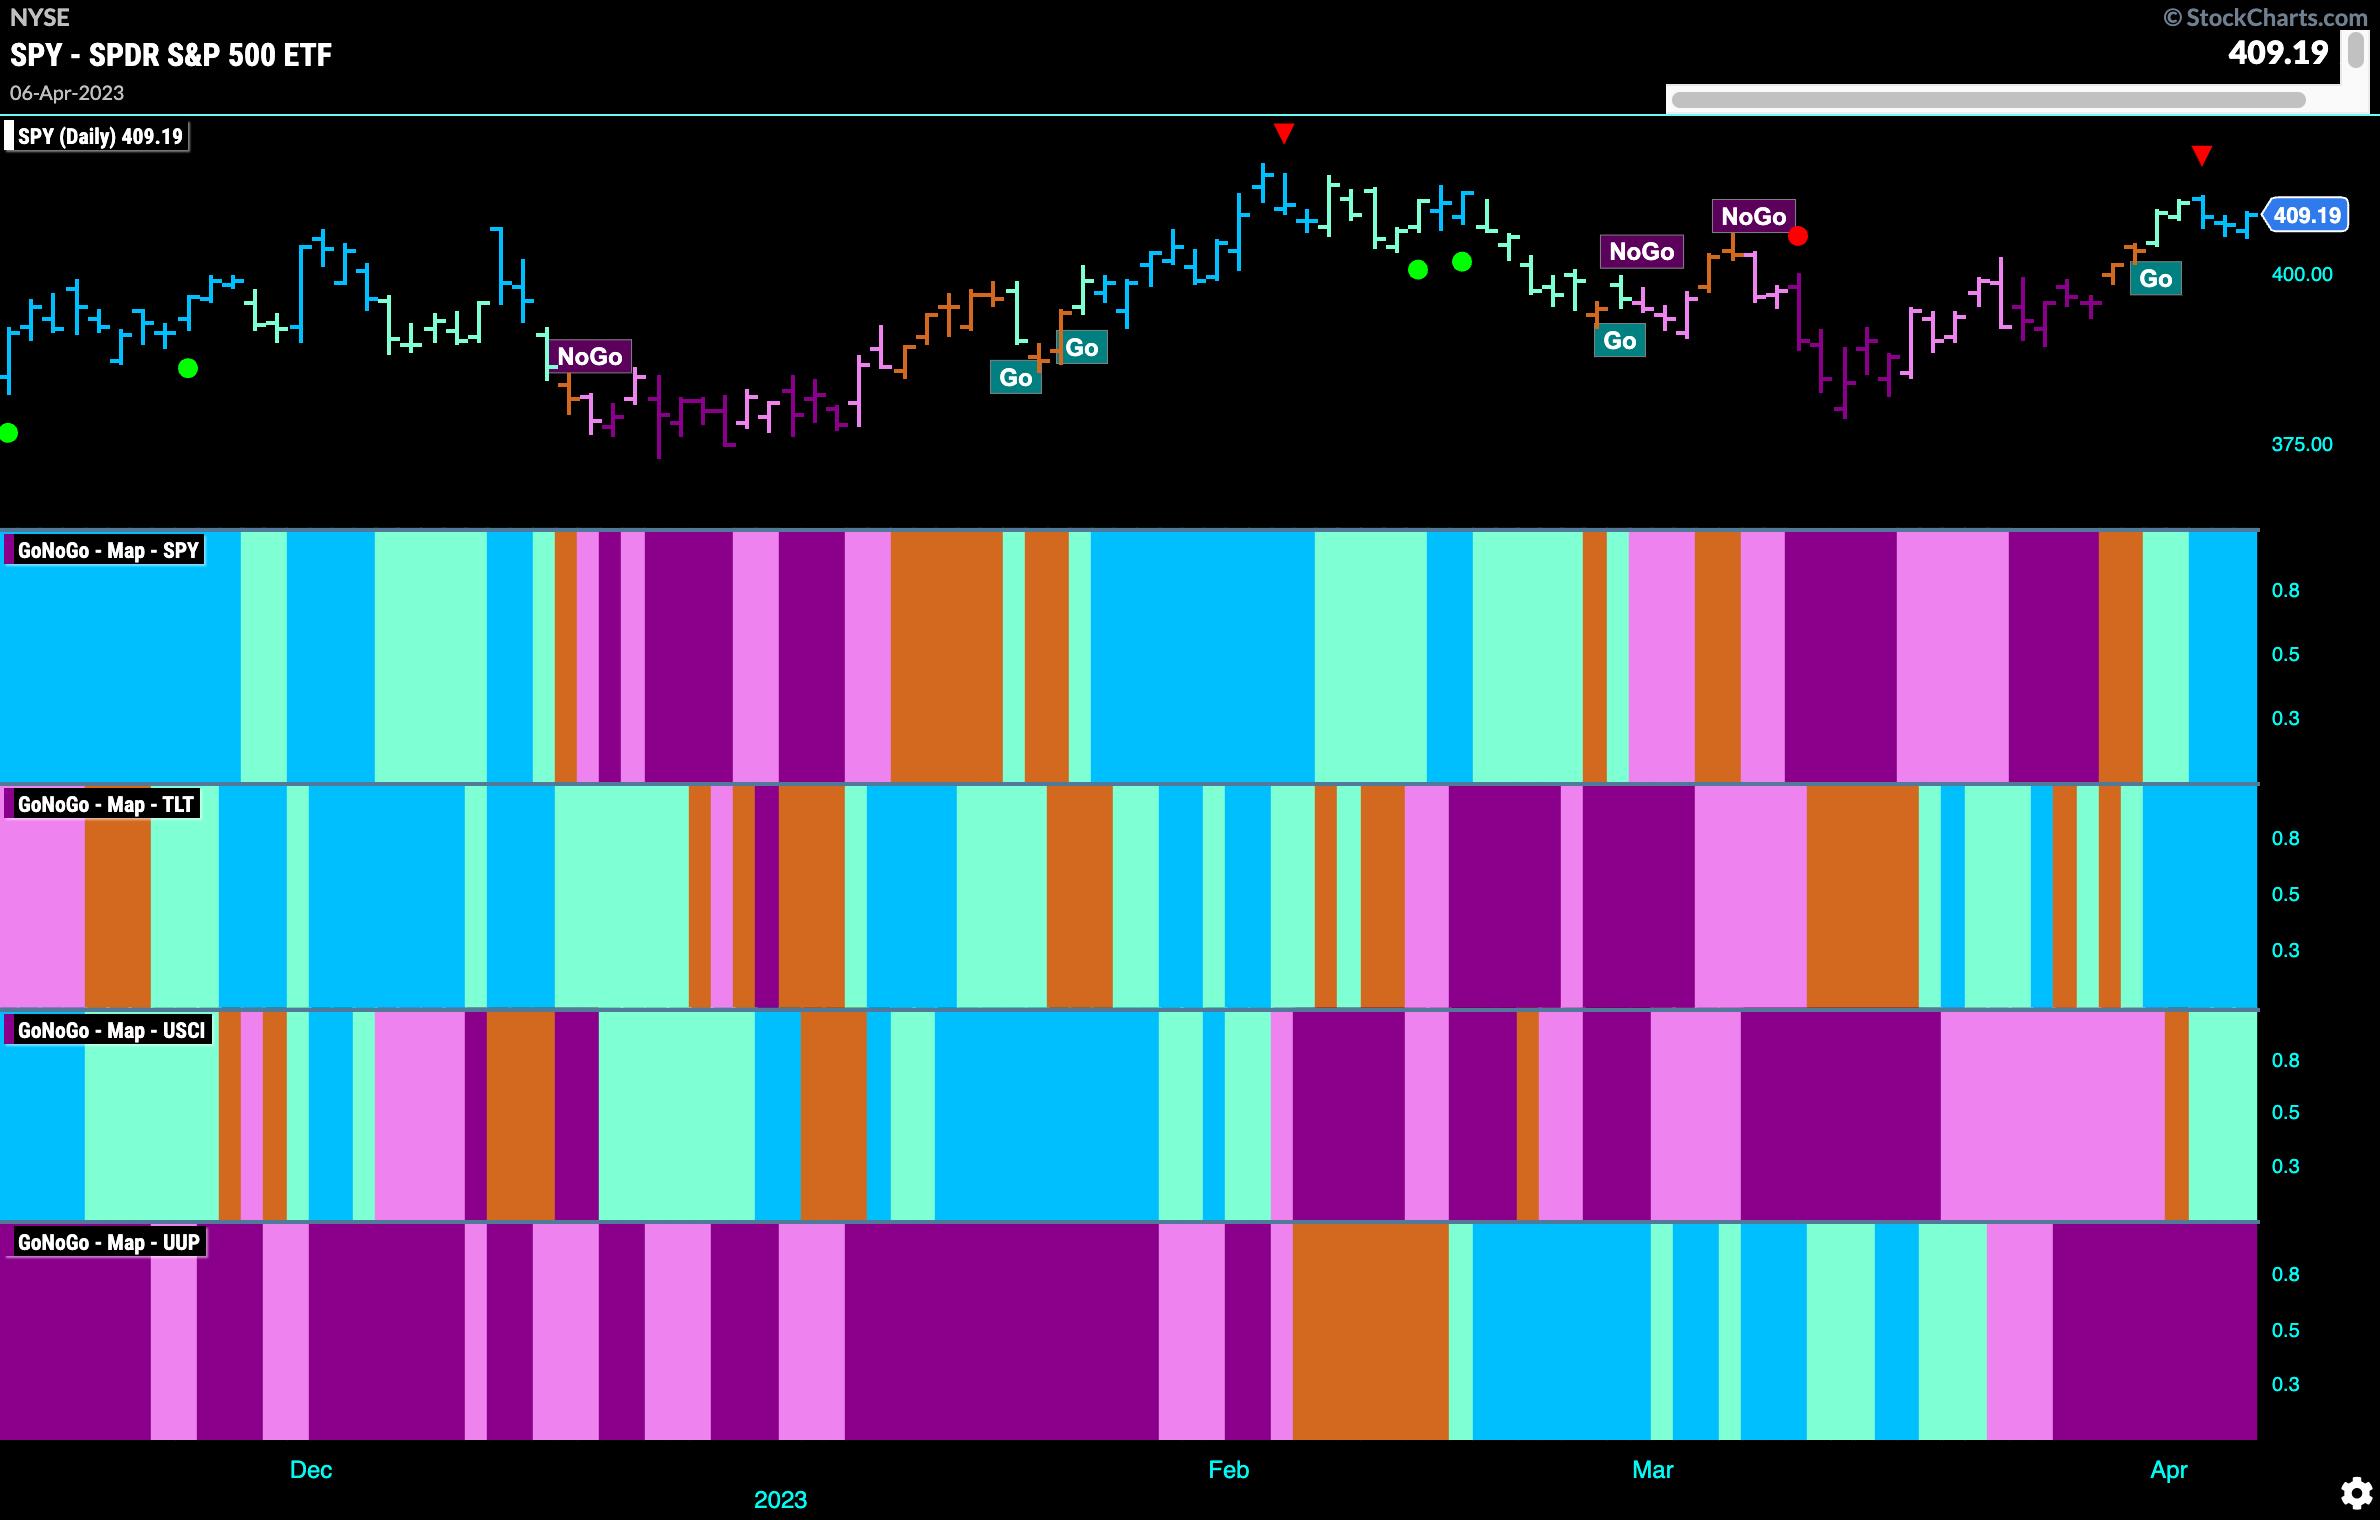
Equities Paint Strong Blue "Go" Bars
After breaking out of the Max GoNoGo Squeeze a week ago, there has been a string of "Go" bars painted by GoNoGo Trend. While price failed to end the week higher, it's seeing brighter blue bars as price tries to climb to test prior highs from earlier this year.

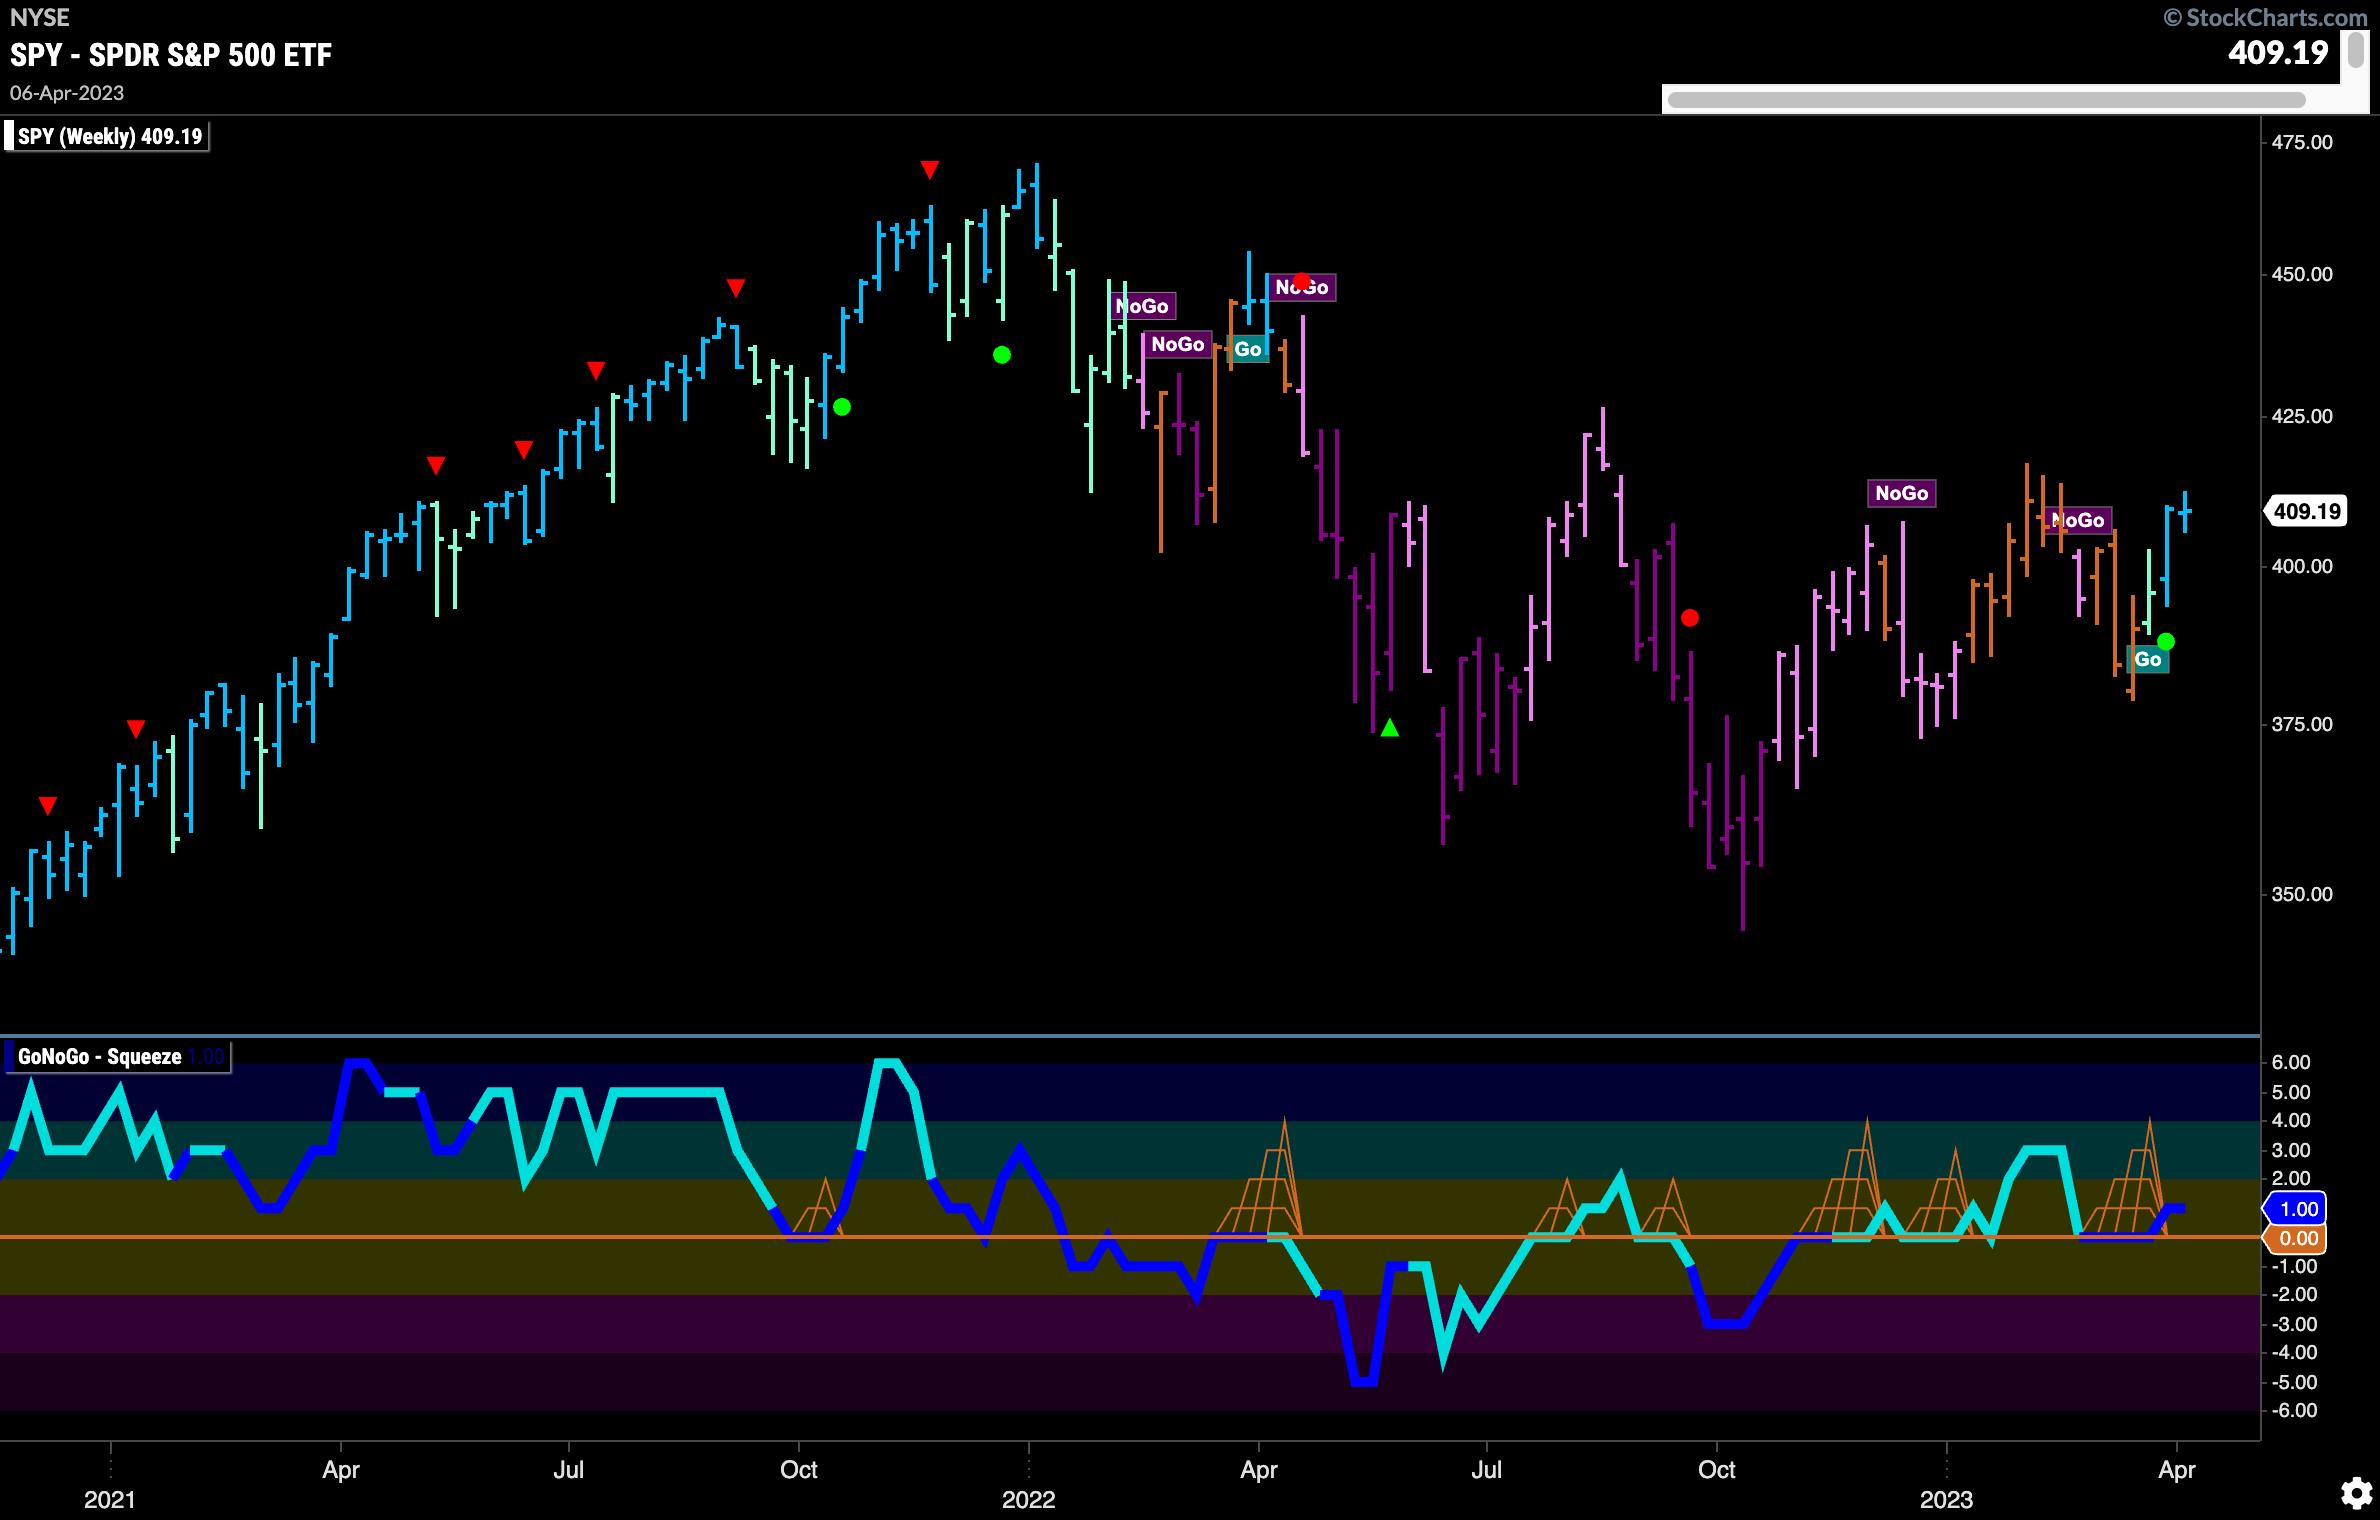
The weekly chart shows the "Go" trend remaining in place, with another strong blue "Go" bar painted. Those astute candlestick chartists will notice last week's candle represents a "doji" (uncertainty), with the open and close at similar levels. GoNoGo Oscillator shows that momentum is on the side of the "Go" trend as it breaks out of a small GoNoGo Squeeze into positive territory.
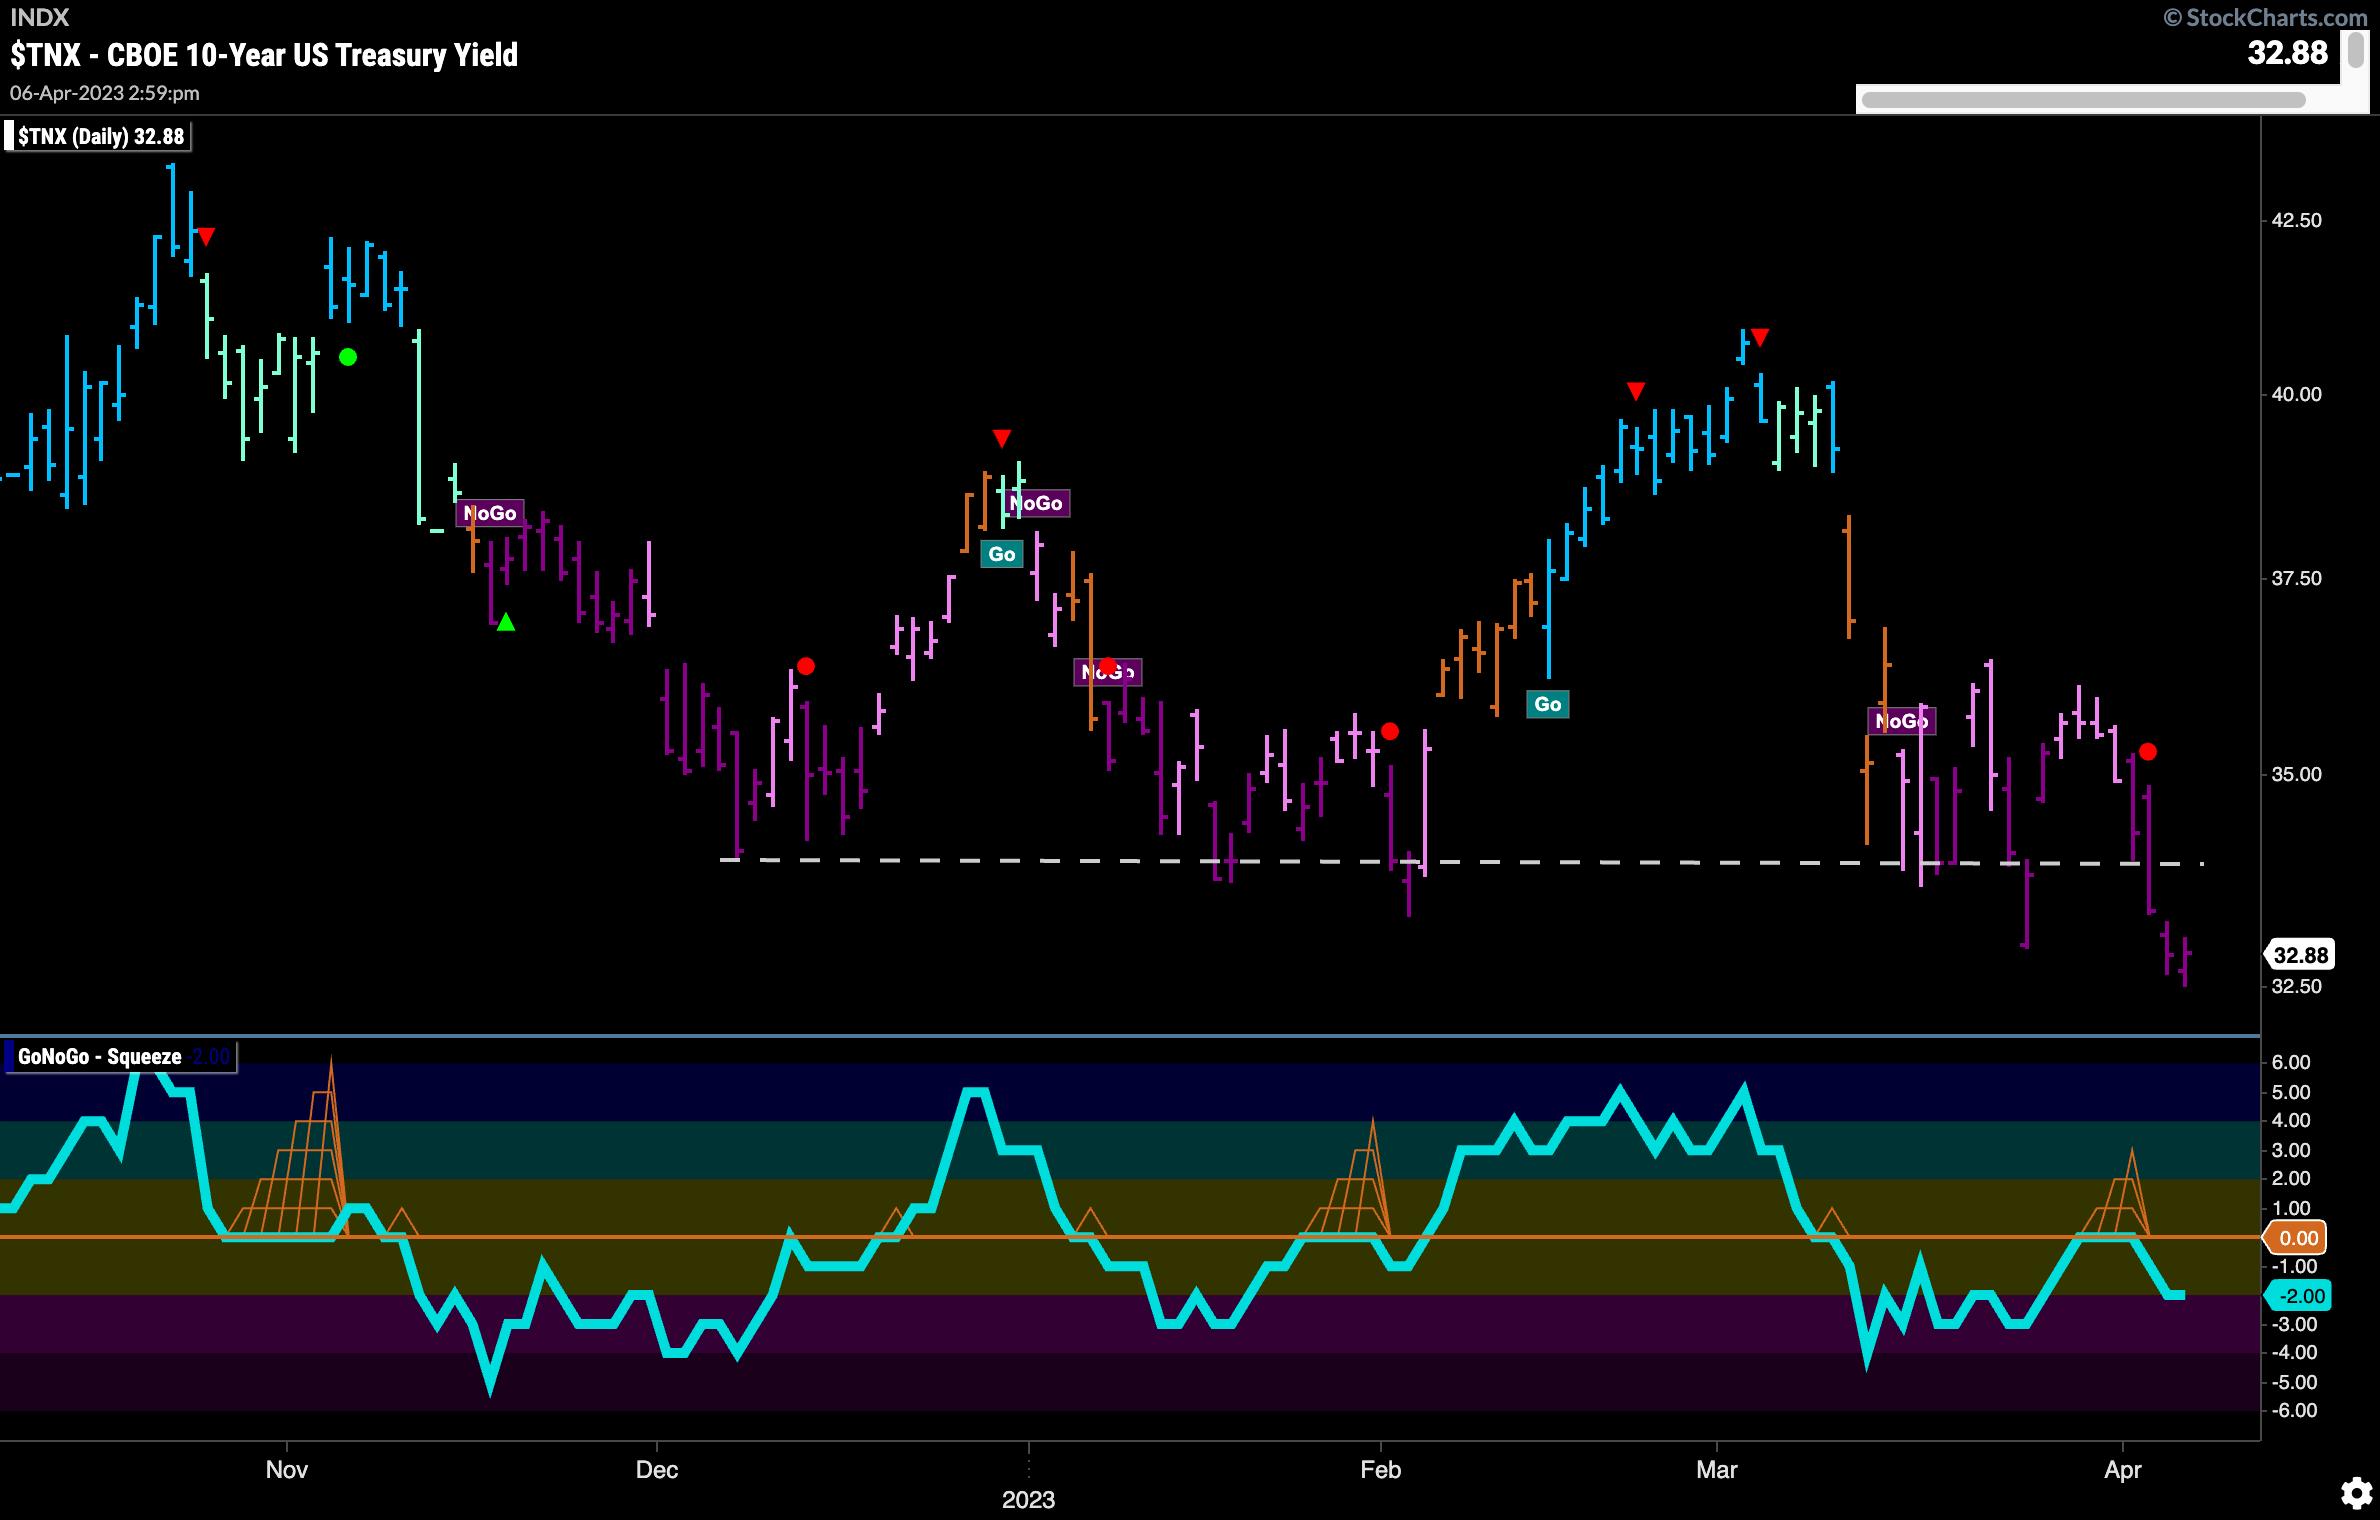
Treasury Rates Fall to New Lows
Treasury rates painted mostly strong purple "NoGo" bars this week as price tested, then fell below horizontal support. As this happened, GoNoGo Oscillator confirmed by testing the zero line from below and then being rejected, falling back into negative territory. This tells us that momentum is resurgent in the direction of the current "NoGo" trend.
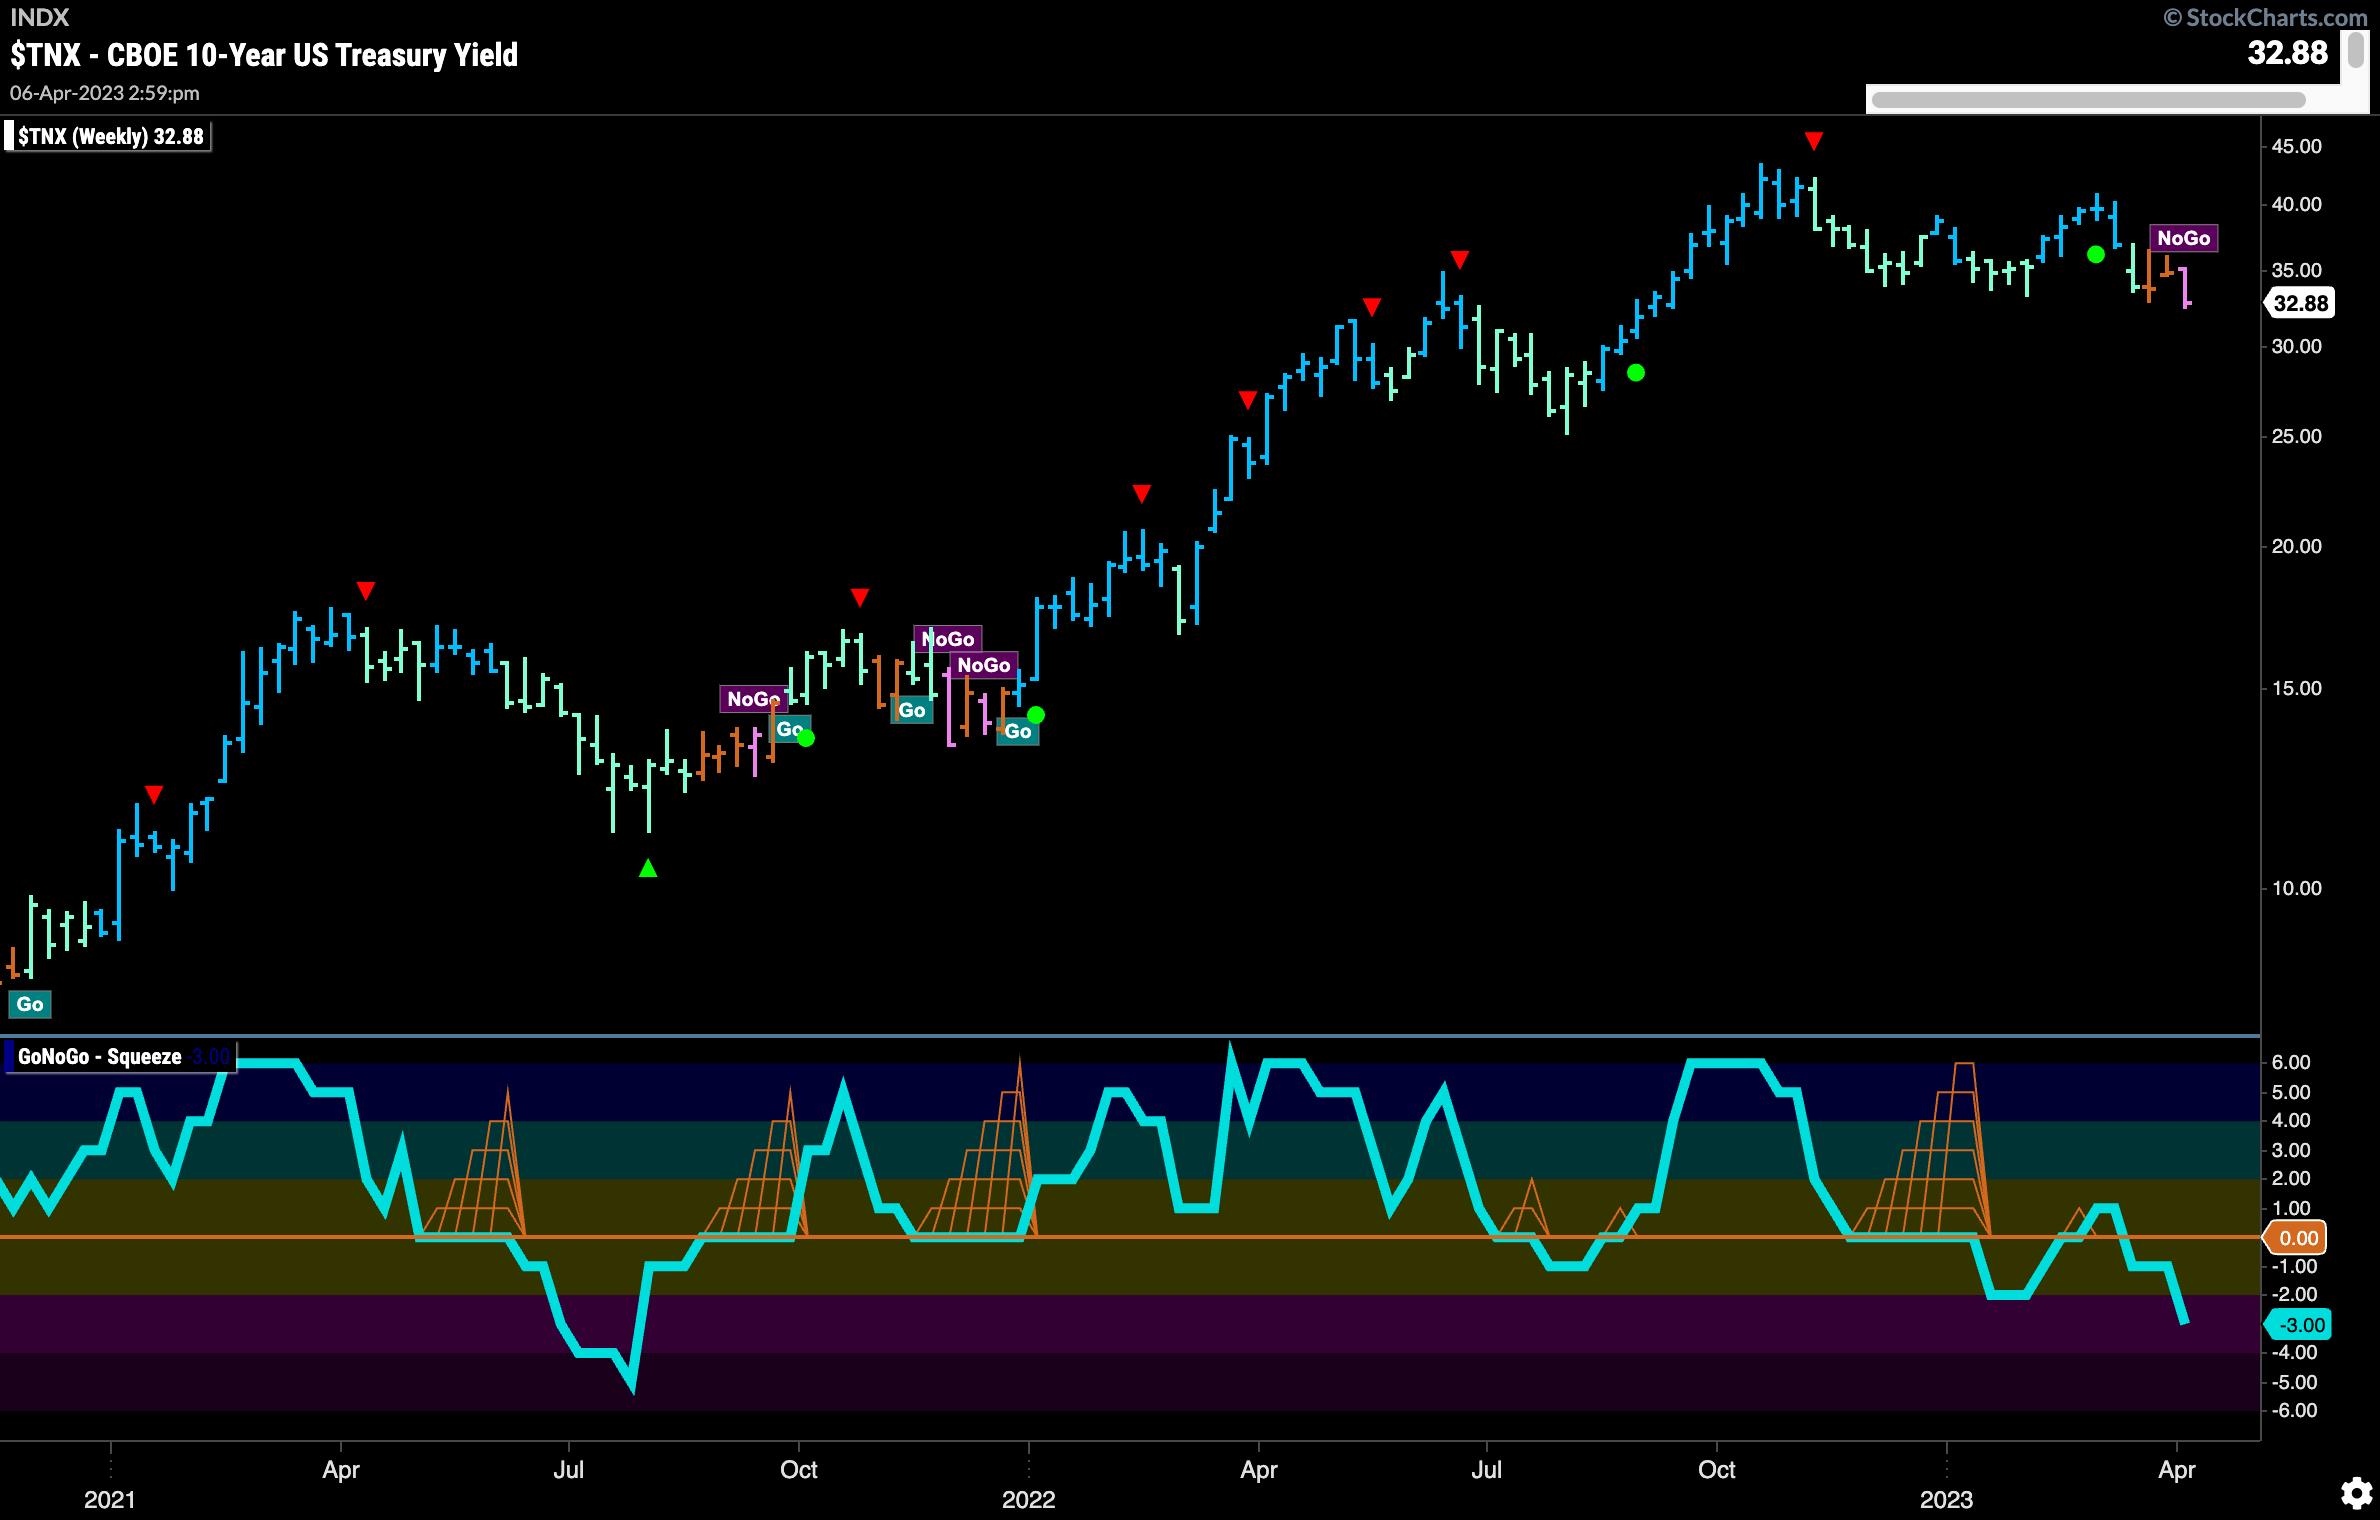
The weekly chart now sees the trend line up with that of the daily periodicity. Last week saw a first pink "NoGo" bar as GoNoGo Trend cycled out of "Go Fish" into a "NoGo" color for the first time since late 2021. The GoNoGo Oscillator is below zero and falling, confirming that momentum is on the side of this new "NoGo".
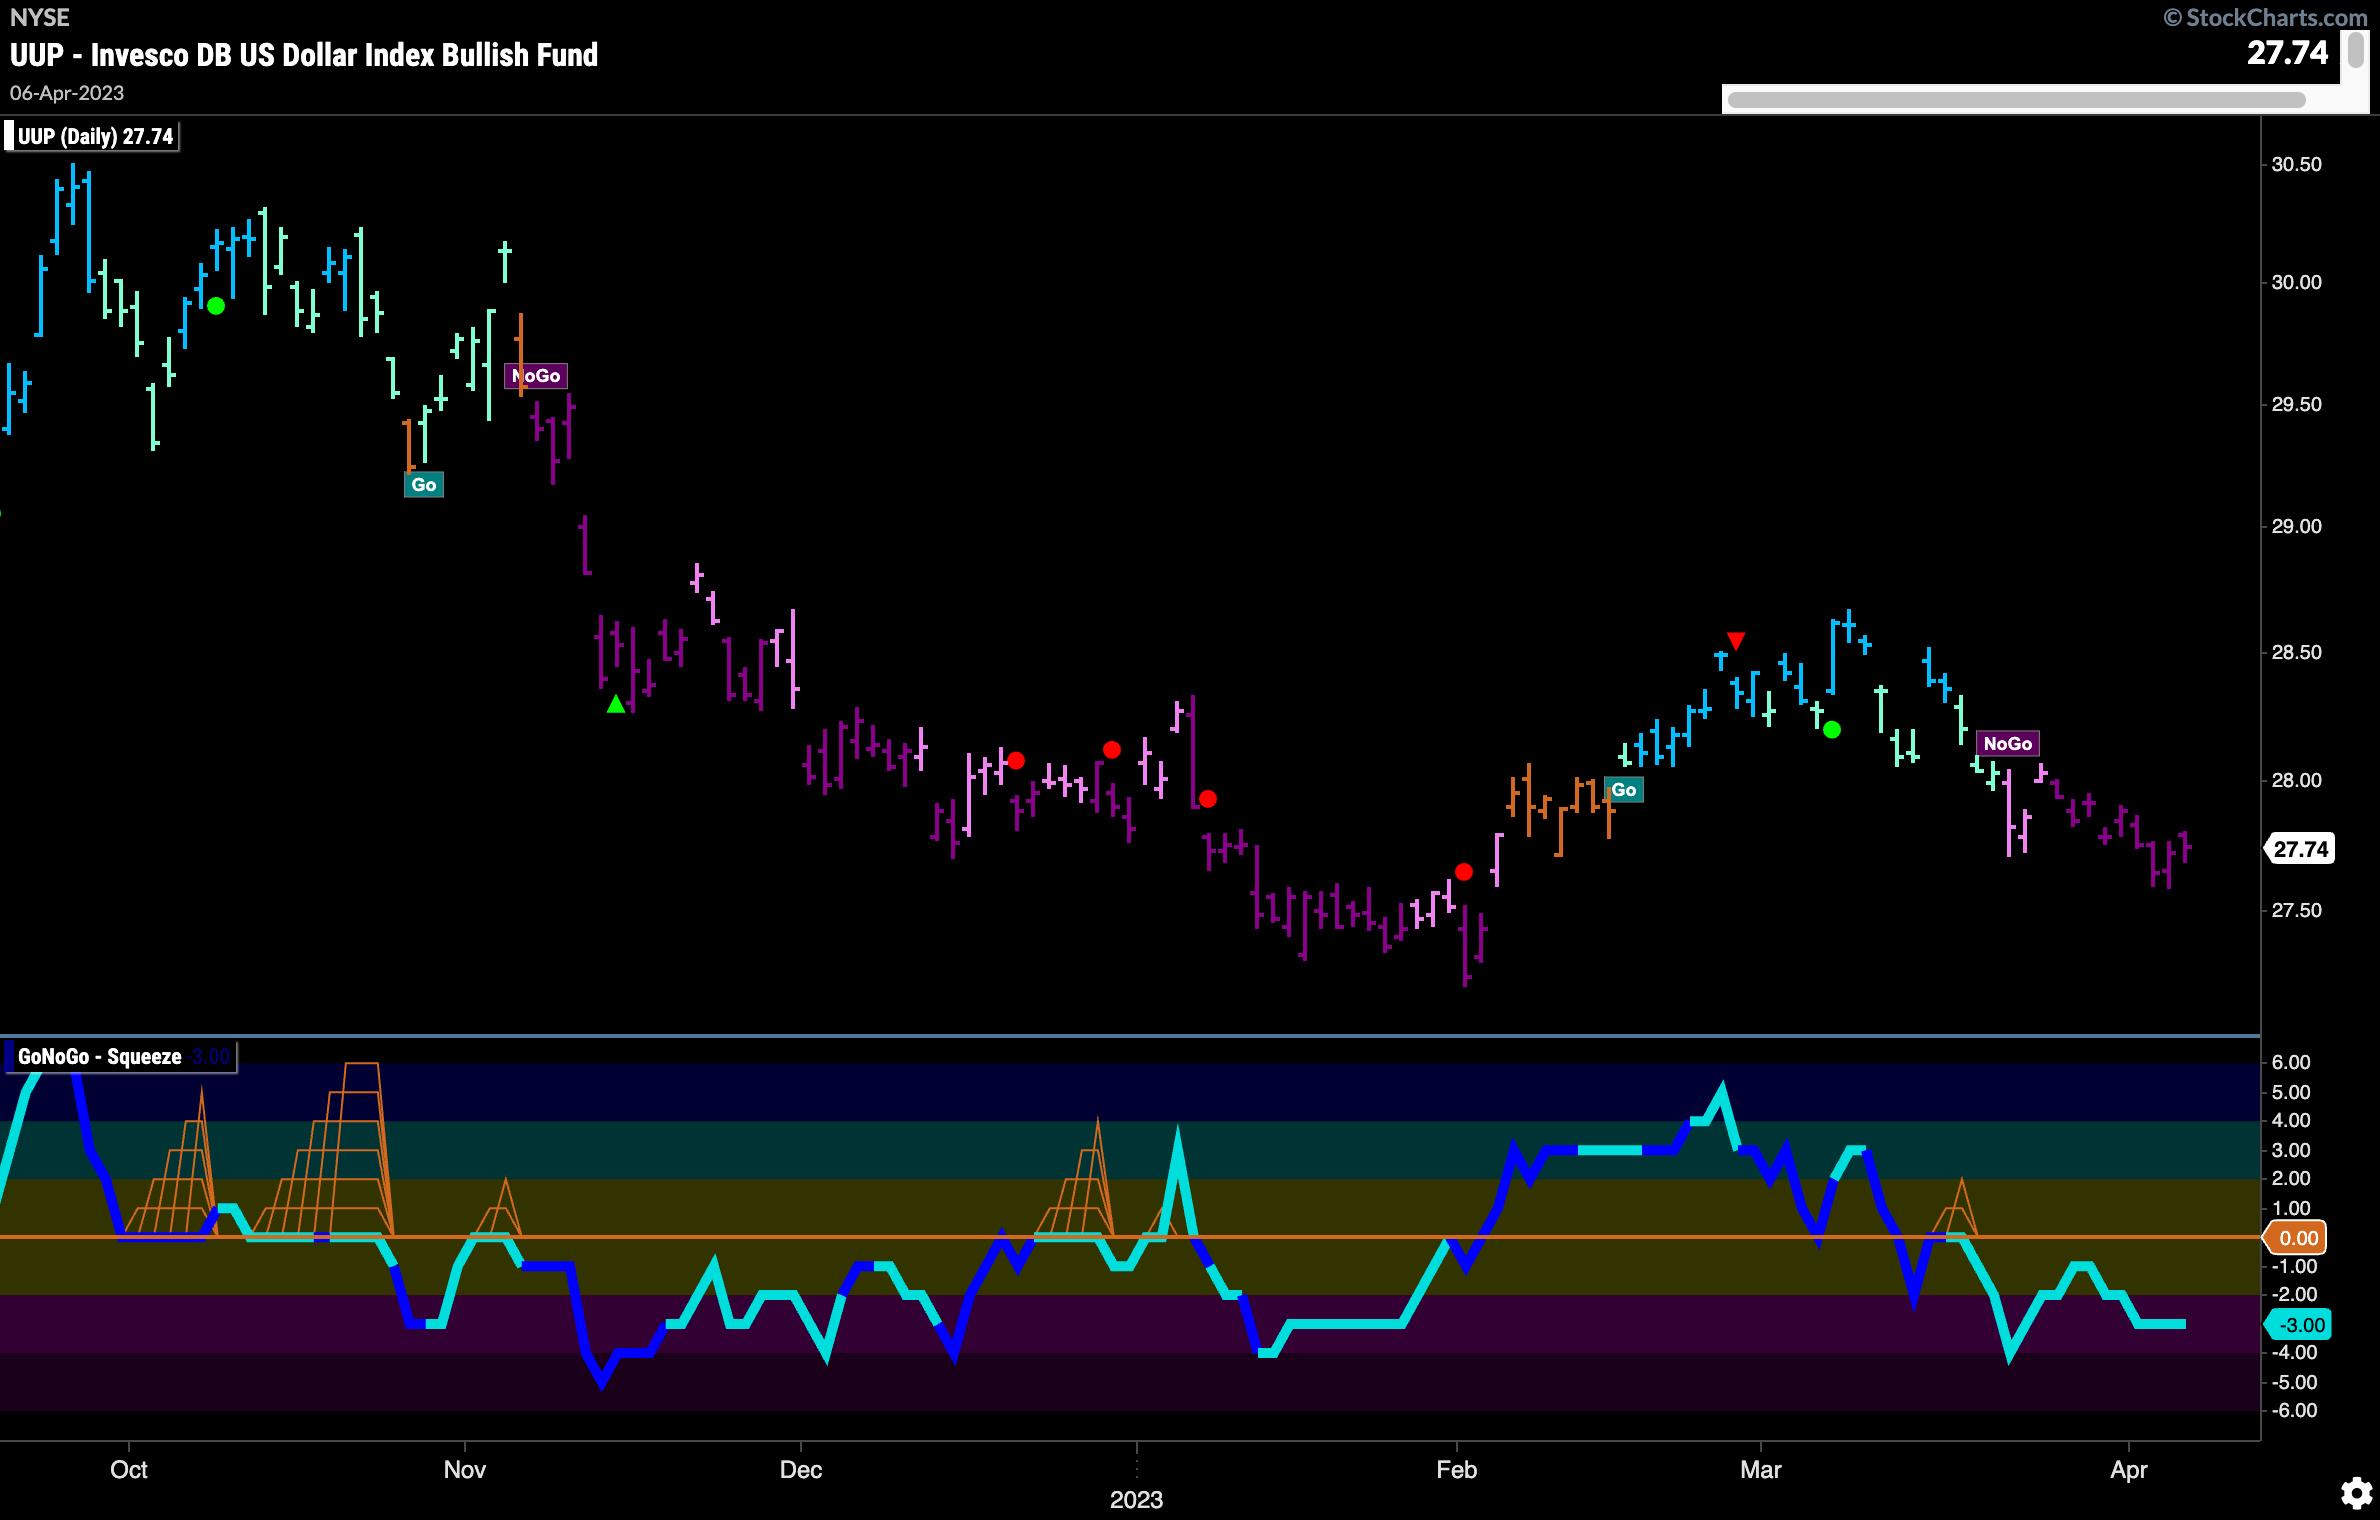
Dollar Continues in "NoGo" Trend
GoNoGo Trend painted uninterrupted strong purple "NoGo" bars this week as prices continued to move lower. In striking range of the February lows, we will watch to see if these levels are tested. GoNoGo Oscillator is in negative territory, but not oversold.
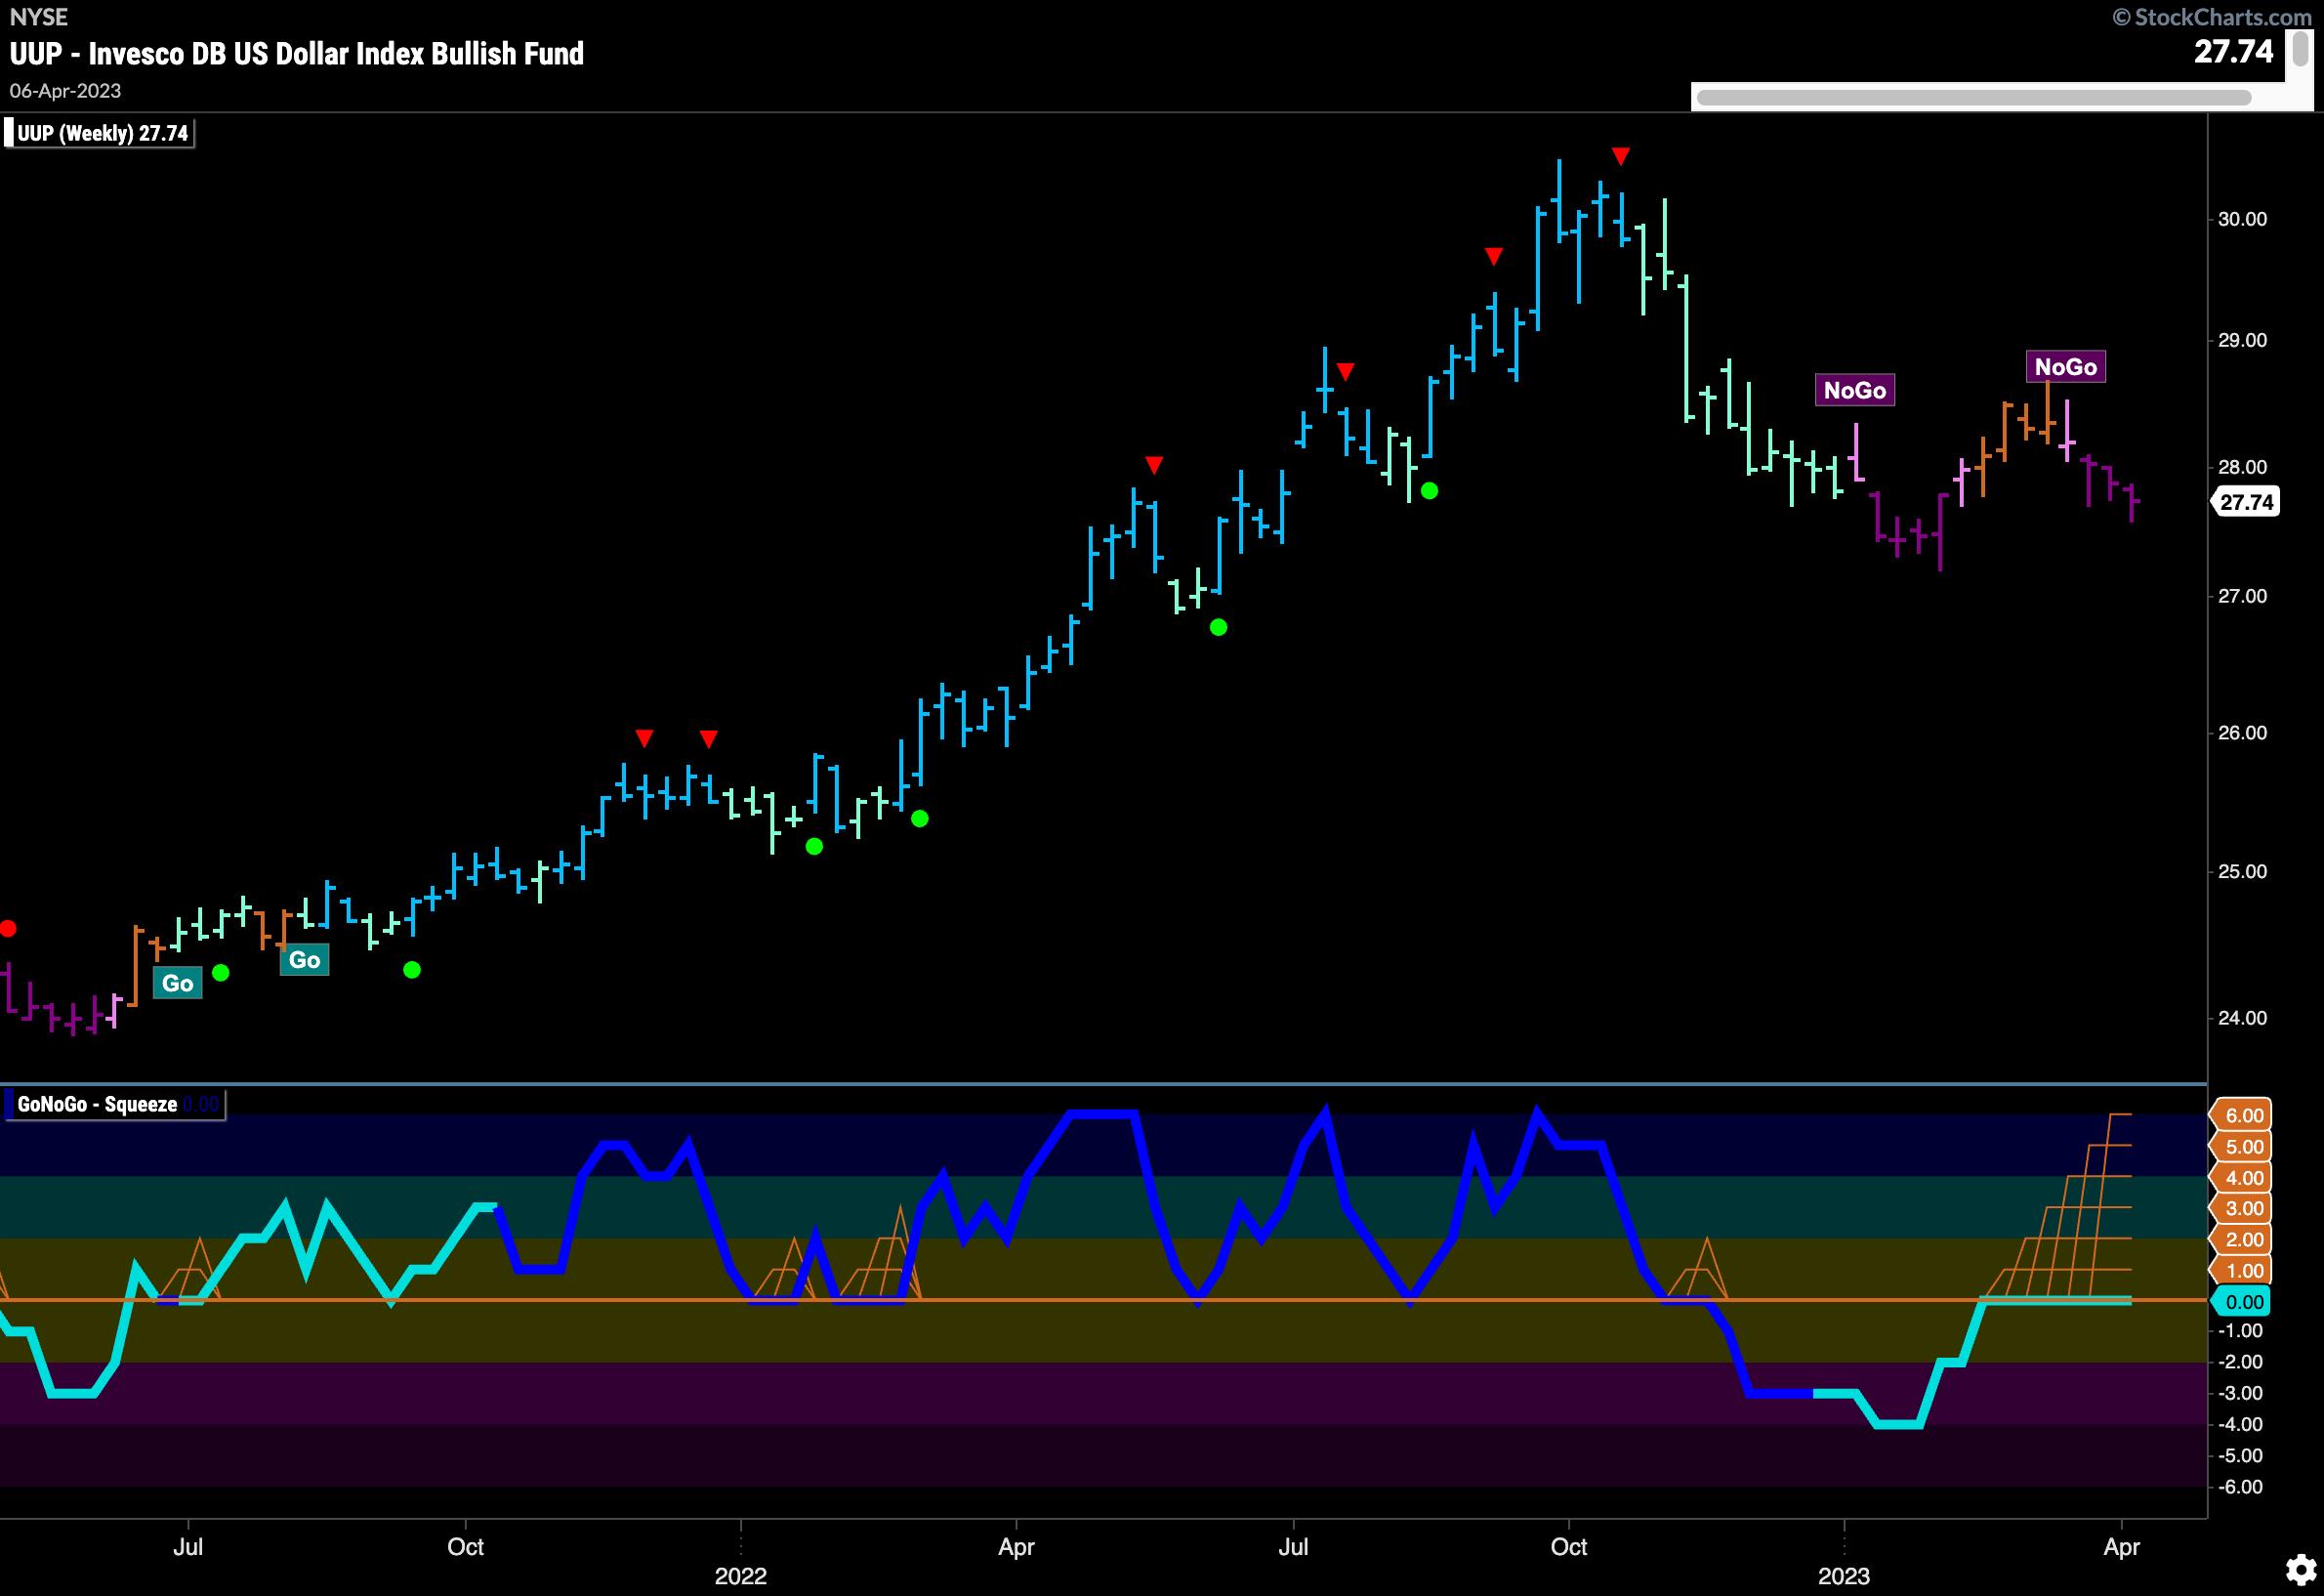
The weekly chart shows little change from where we were last week. Prices have moved slightly lower. The GoNoGo Oscillator remains at zero and a Max GoNoGo Squeeze is in effect. Watch to see if prices test prior lows. This would be more likely should the GoNoGo Oscillator fail at the zero line and get turned away into negative territory again.
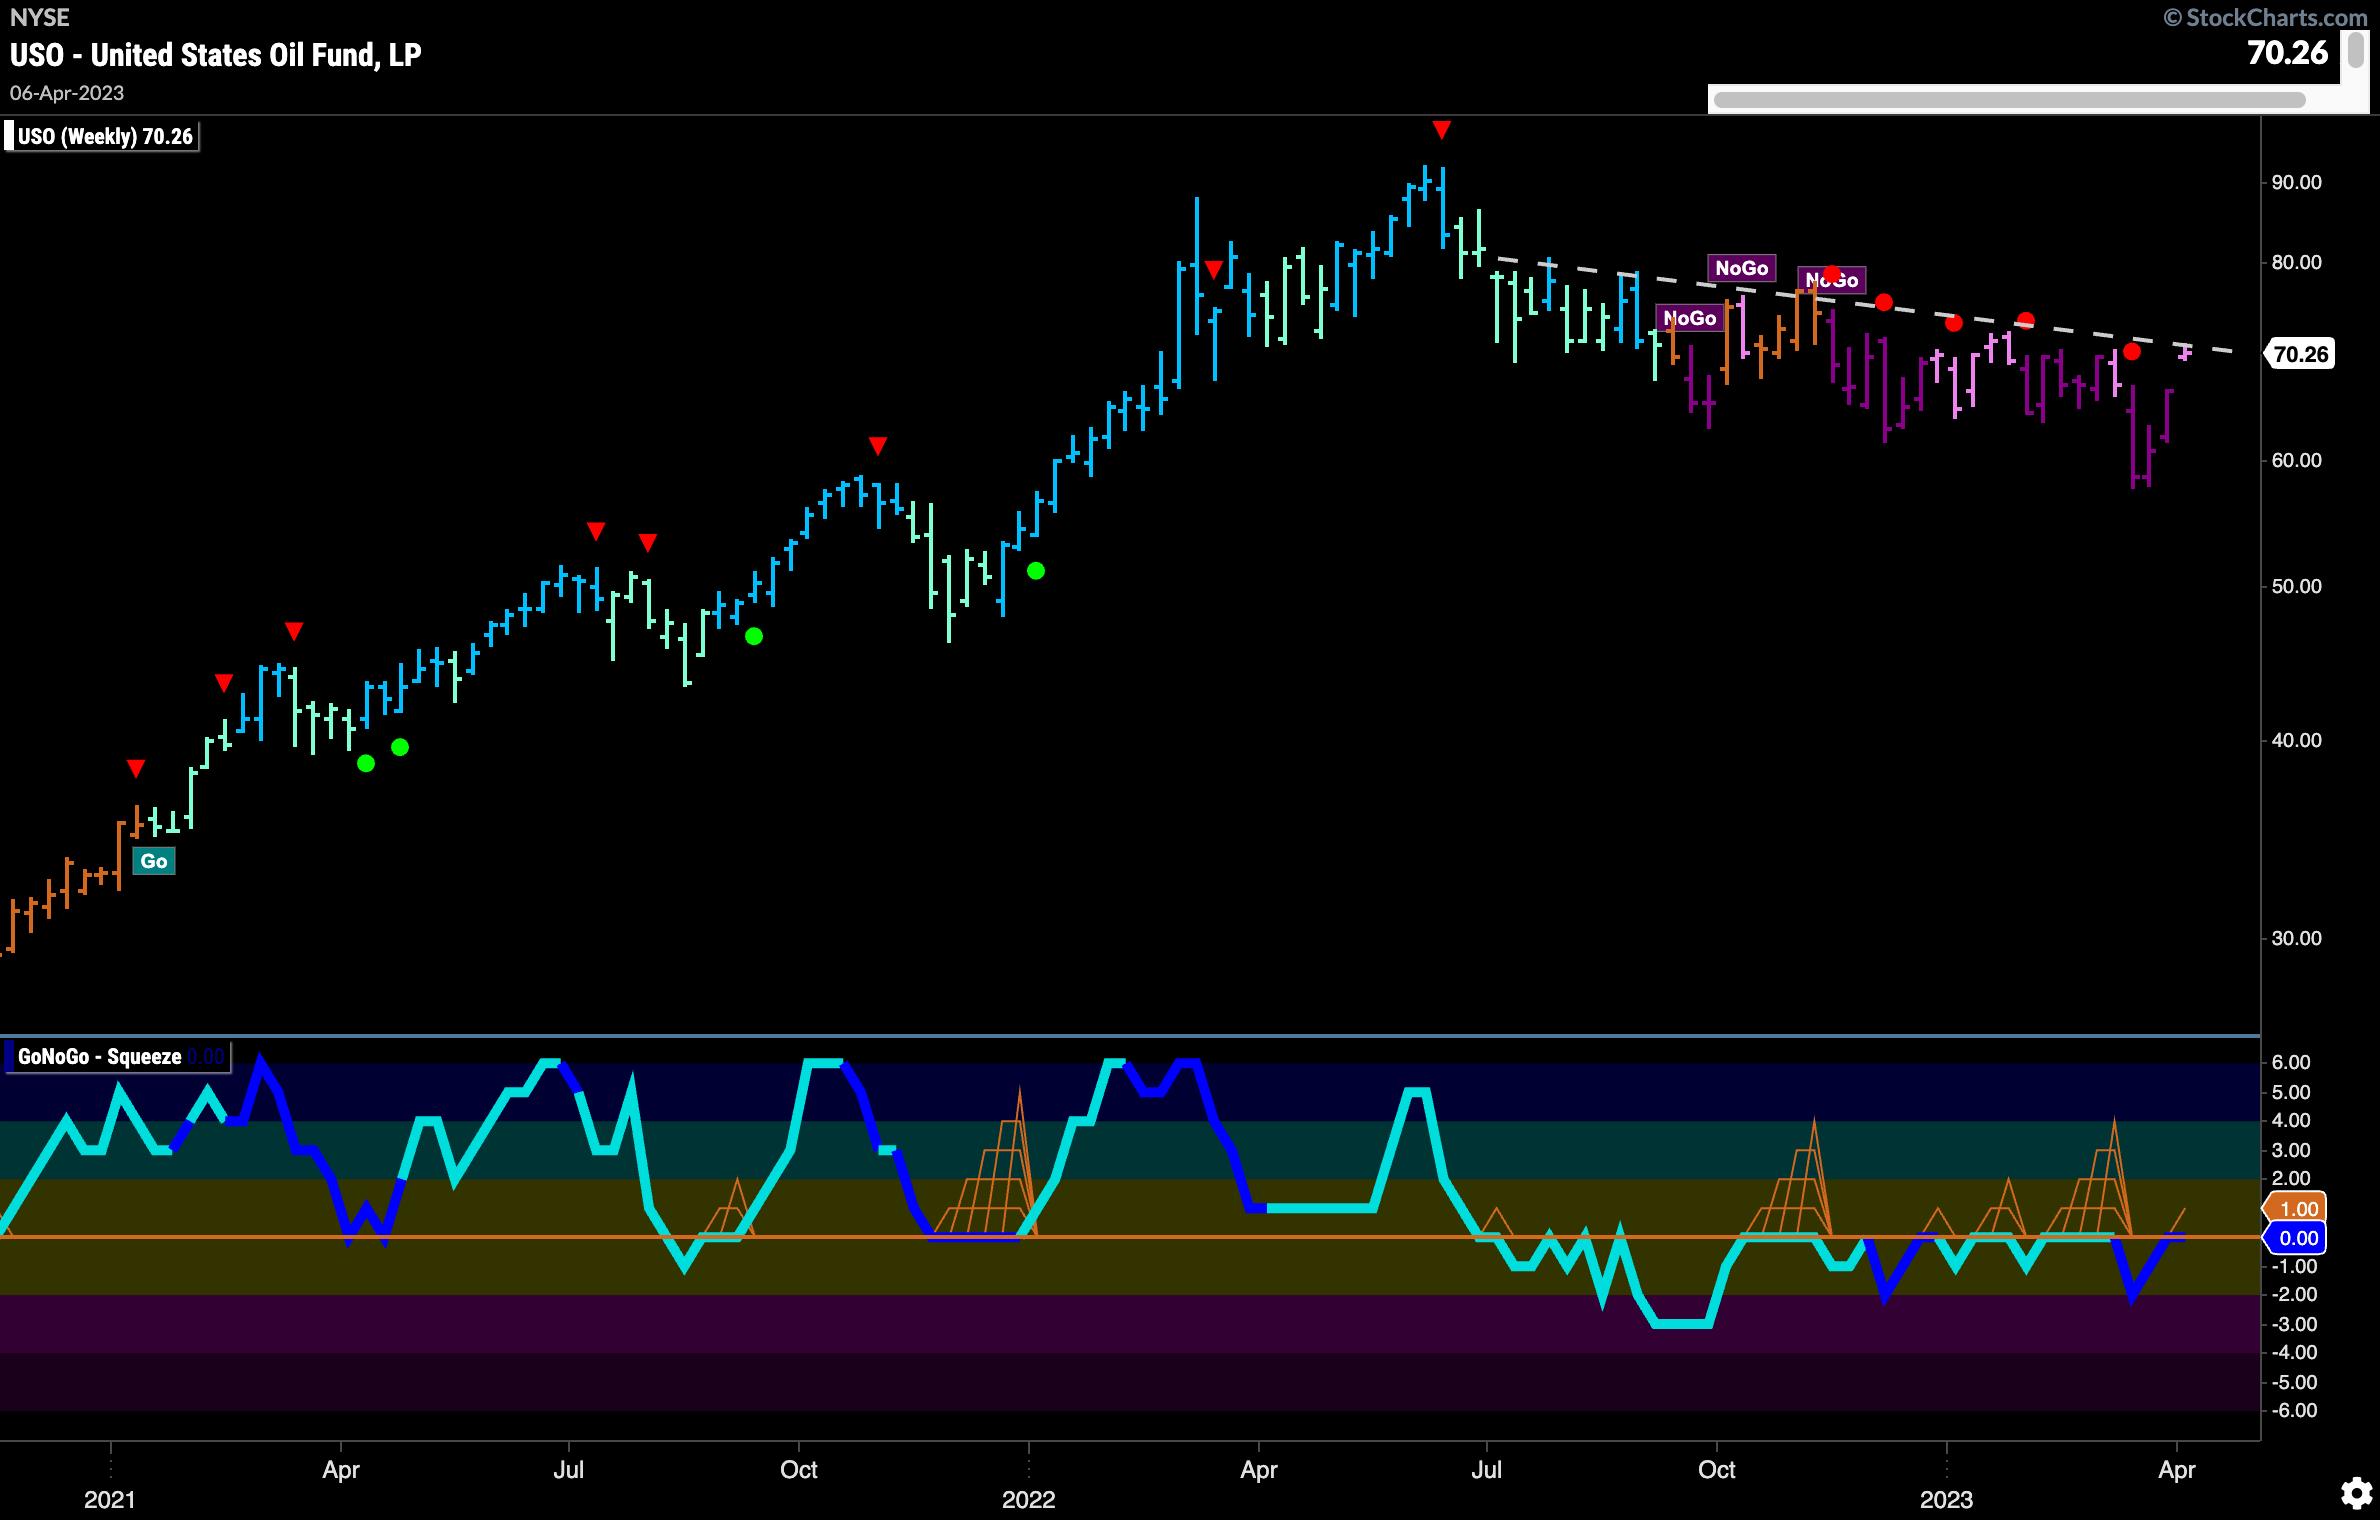
Oil's Gap Higher Puts Price at Resistance
The United States Oil Fund (USO) saw a jump higher last week and a return to a pink "NoGo" bar. This price action is testing the downward sloping resistance line that has been in place since the summer of last year. As price runs up against resistance, so does GoNoGo Oscillator in the form of the zero line. Since it's quickly returning to that level, it's best to watch to see if it gets rejected and sent lower or if it can break through into positive territory. The second scenario needs to play out if you expect price to move above its own resistance.
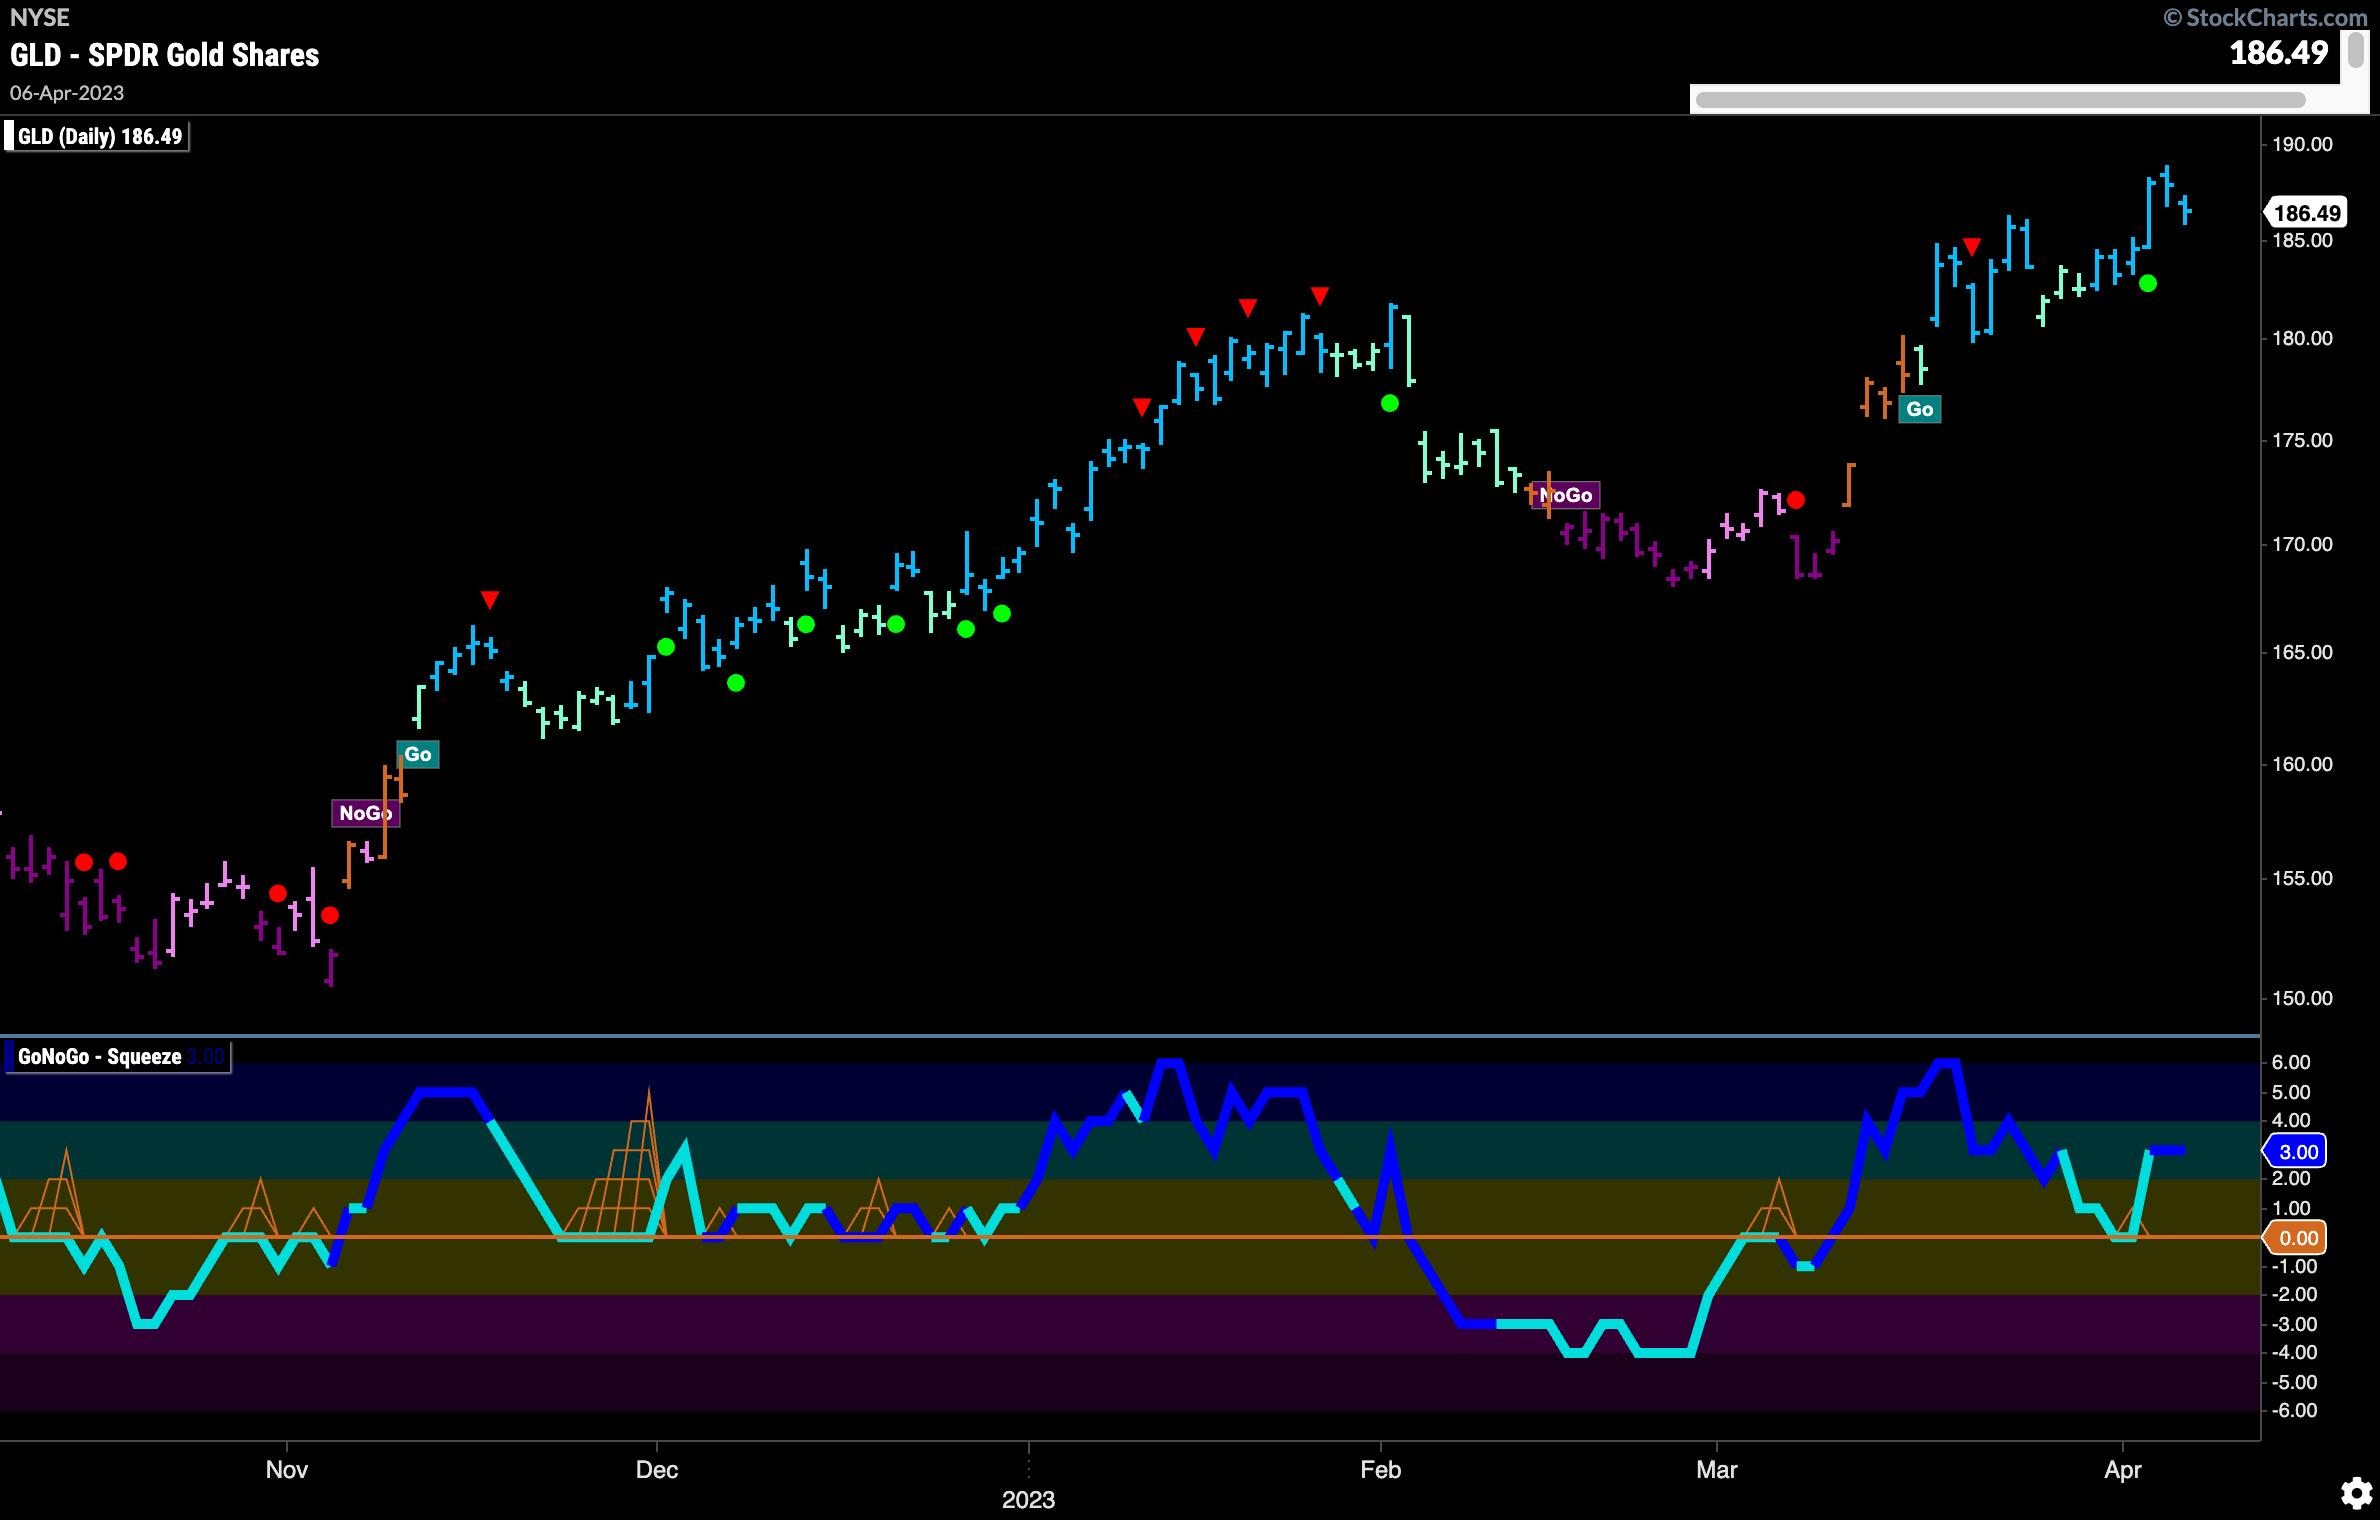
Gold Sets New High
$GLD saw a new high this week, as GoNoGo Trend painted consistent strong blue "Go" bars after the Go Trend Continuation Icon (green circle) that occurred midweek.The GoNoGo Oscillator fell to the zero line and found support immediately, bouncing back into positive territory.