Welcome to this week's Flight Path.
Look at the GoNoGo Asset map below. Equities have turned! There's a "Go" bar at the end of the week that, as you'll see, also lines up with a new "Go" trend on the weekly chart. Treasury bond prices are also in a "Go" trend, and the US dollar continues in its "NoGo" trend. Commodities continue to struggle.
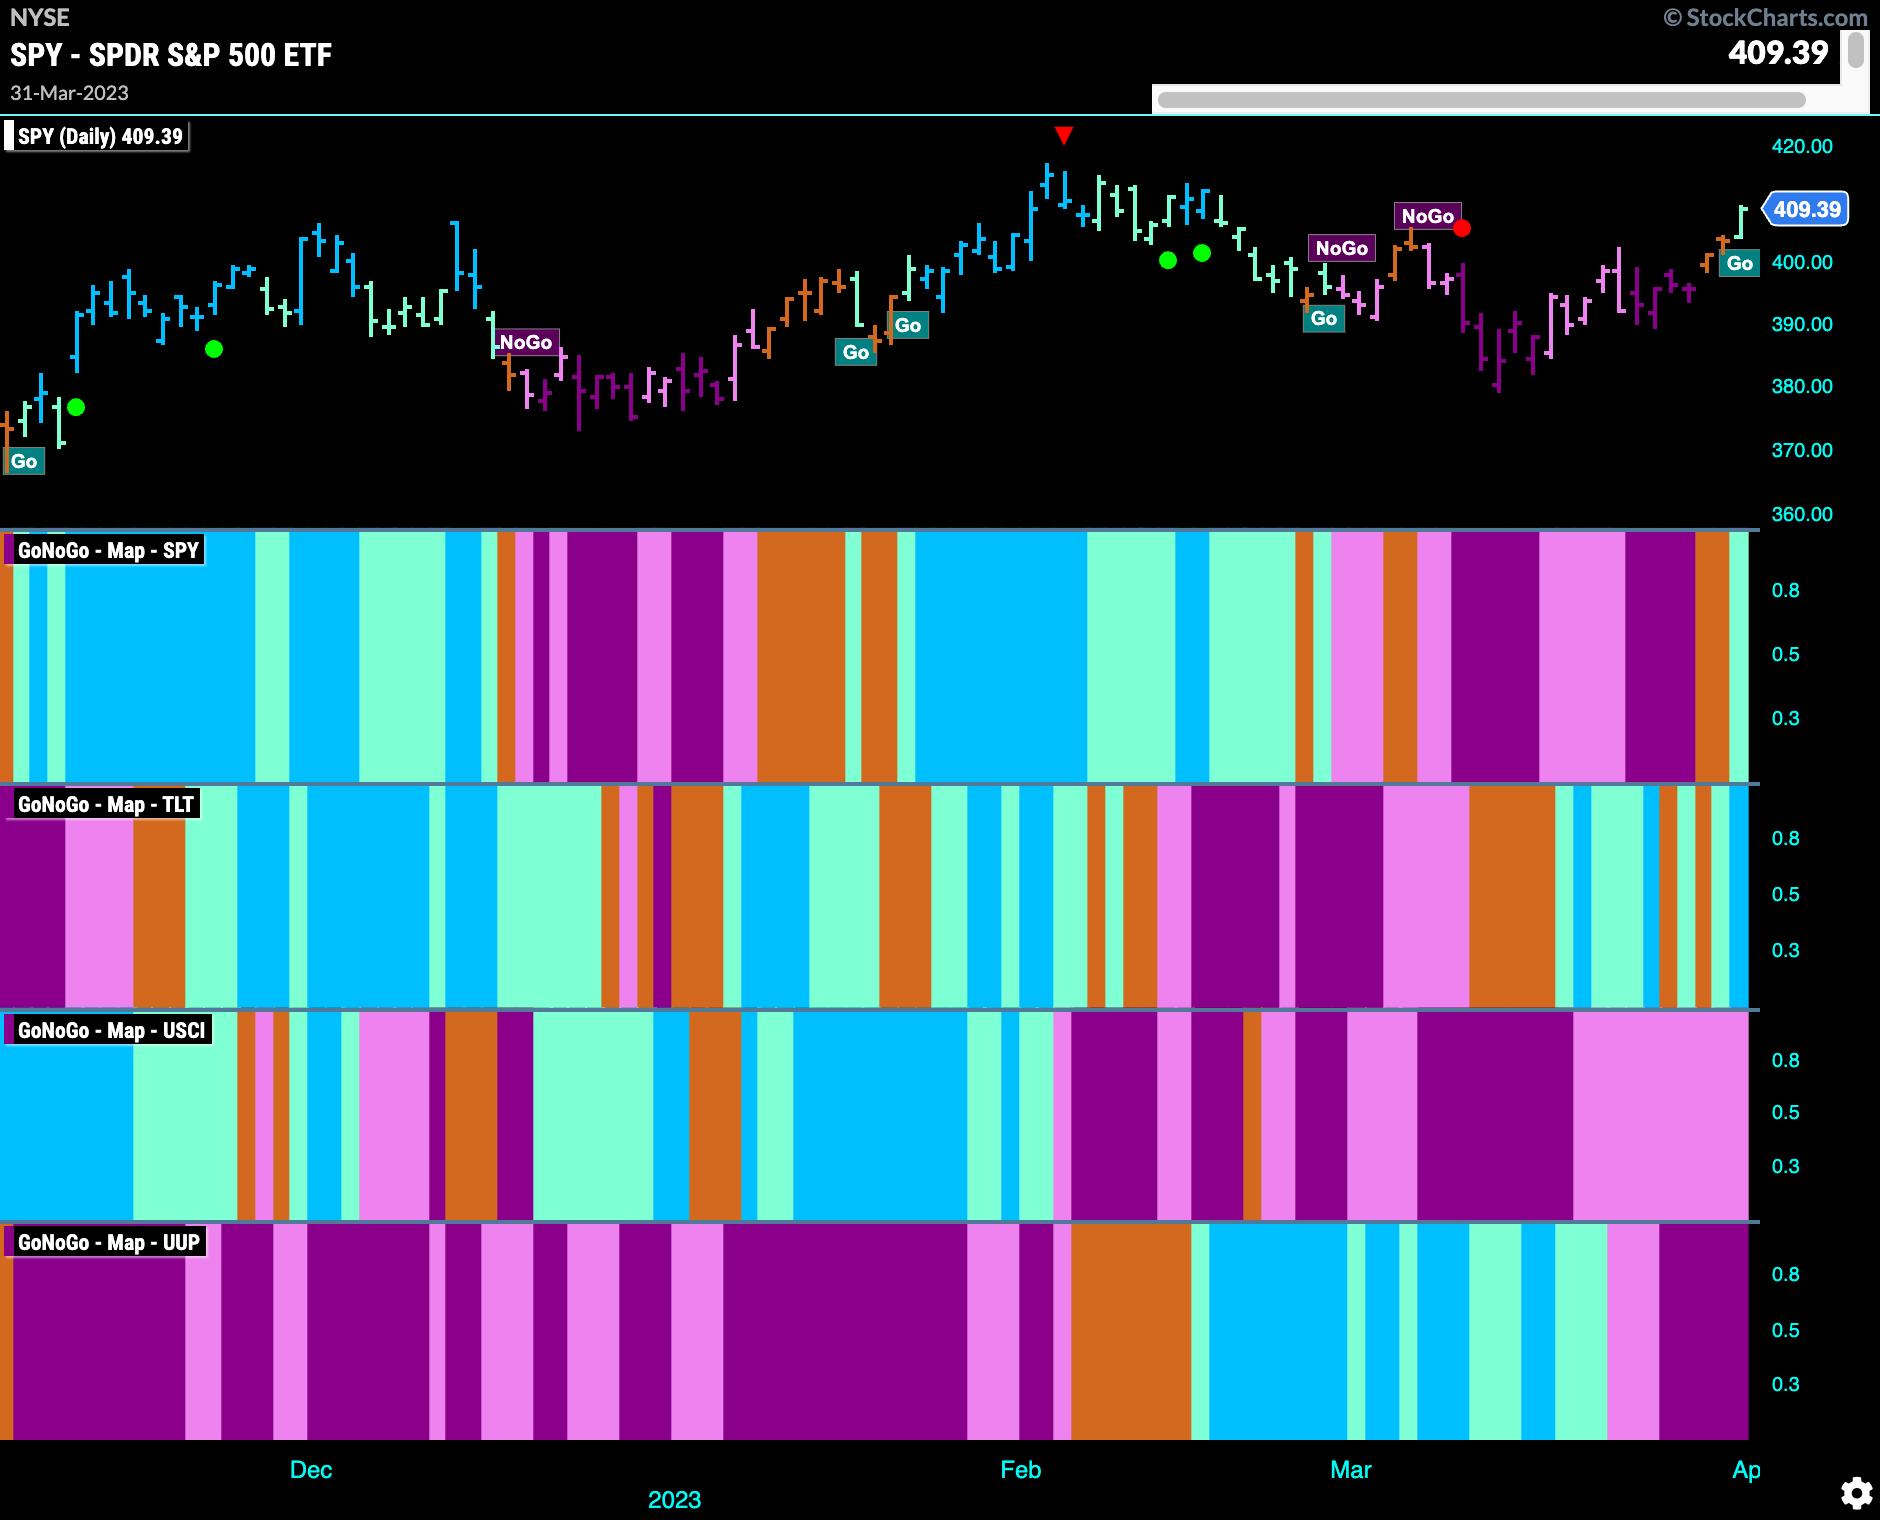
CHART 1: ASSET MAP. Equities have turned, as have Treasury bond prices. The US dollar and commodities continue to struggle.Chart source: StockChartsACP. For illustrative purposes only.
Equities Break Out of Squeeze Into "Go" Trend
The Max GoNoGo Squeeze we saw on US equities last week was broken this week—the GoNoGo Oscillator burst into positive territory, and that gave price the push it needed to cycle through amber "Go Fish" and into a "Go" trend. There was an initial aqua bar on Friday as price moved higher.
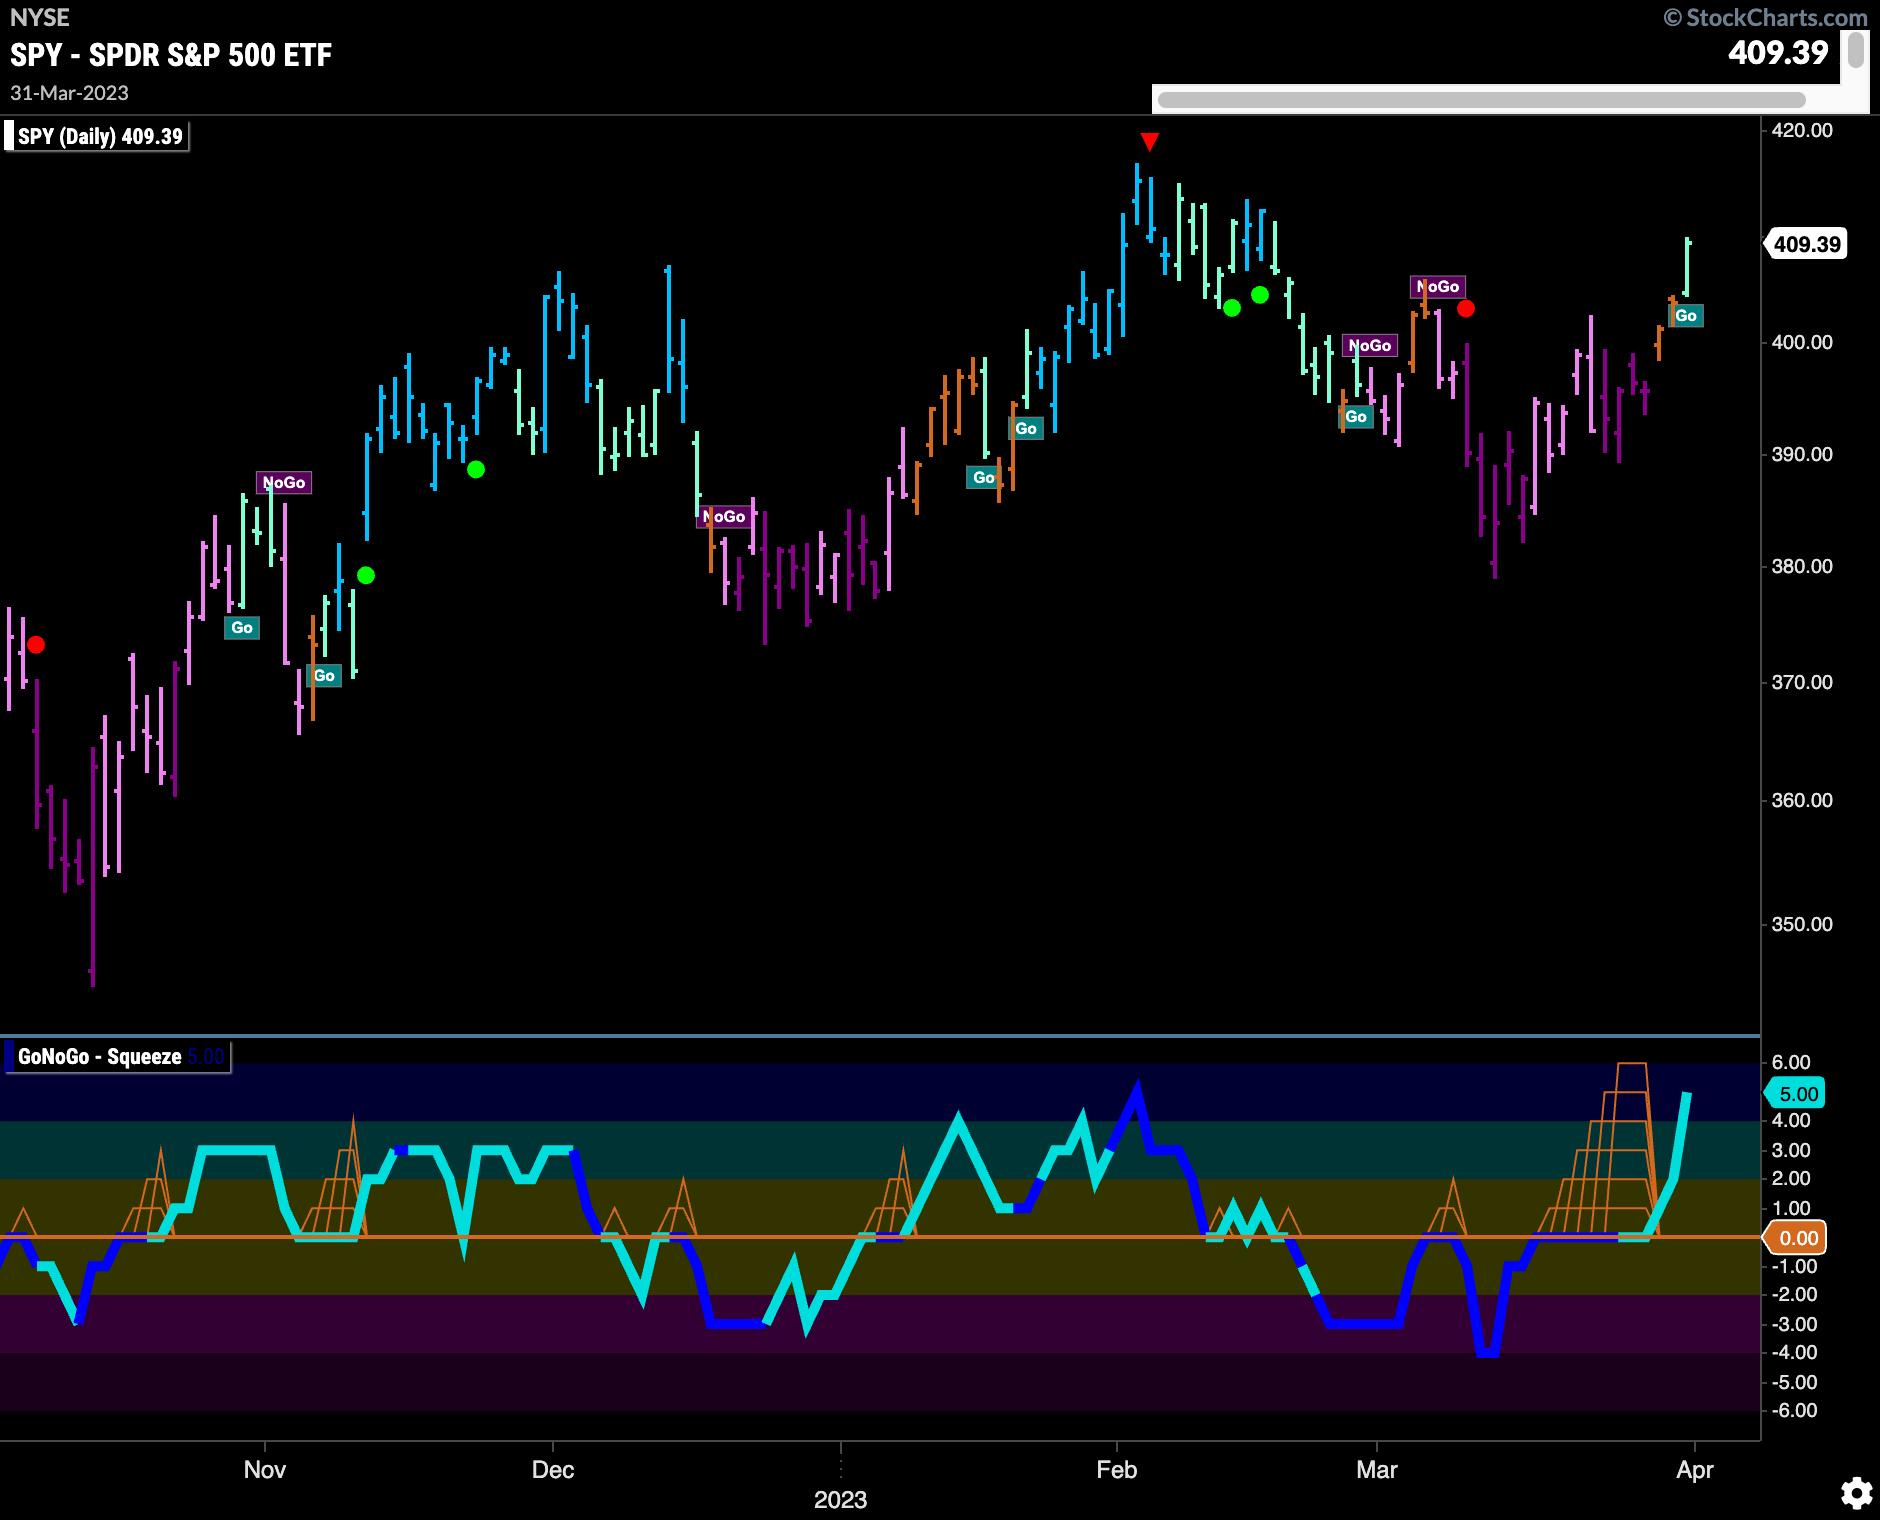
CHART 2: EQUITIES BREAK OUT. The daily chart of SPDR S&P 500 ETF (SPY) got a push to go into trend mode.Chart source: StockChartsACP. For illustrative purposes only.
The weekly chart continues to look strong. Last week's aqua "Go" bar that started the "Go" trend was followed by a strong blue bar this past week. As price puts in another higher low, the GoNoGo Oscillator broke out of a small GoNoGo Squeeze into positive territory on heavy volume. Look for price to attempt a higher high over the next several weeks.
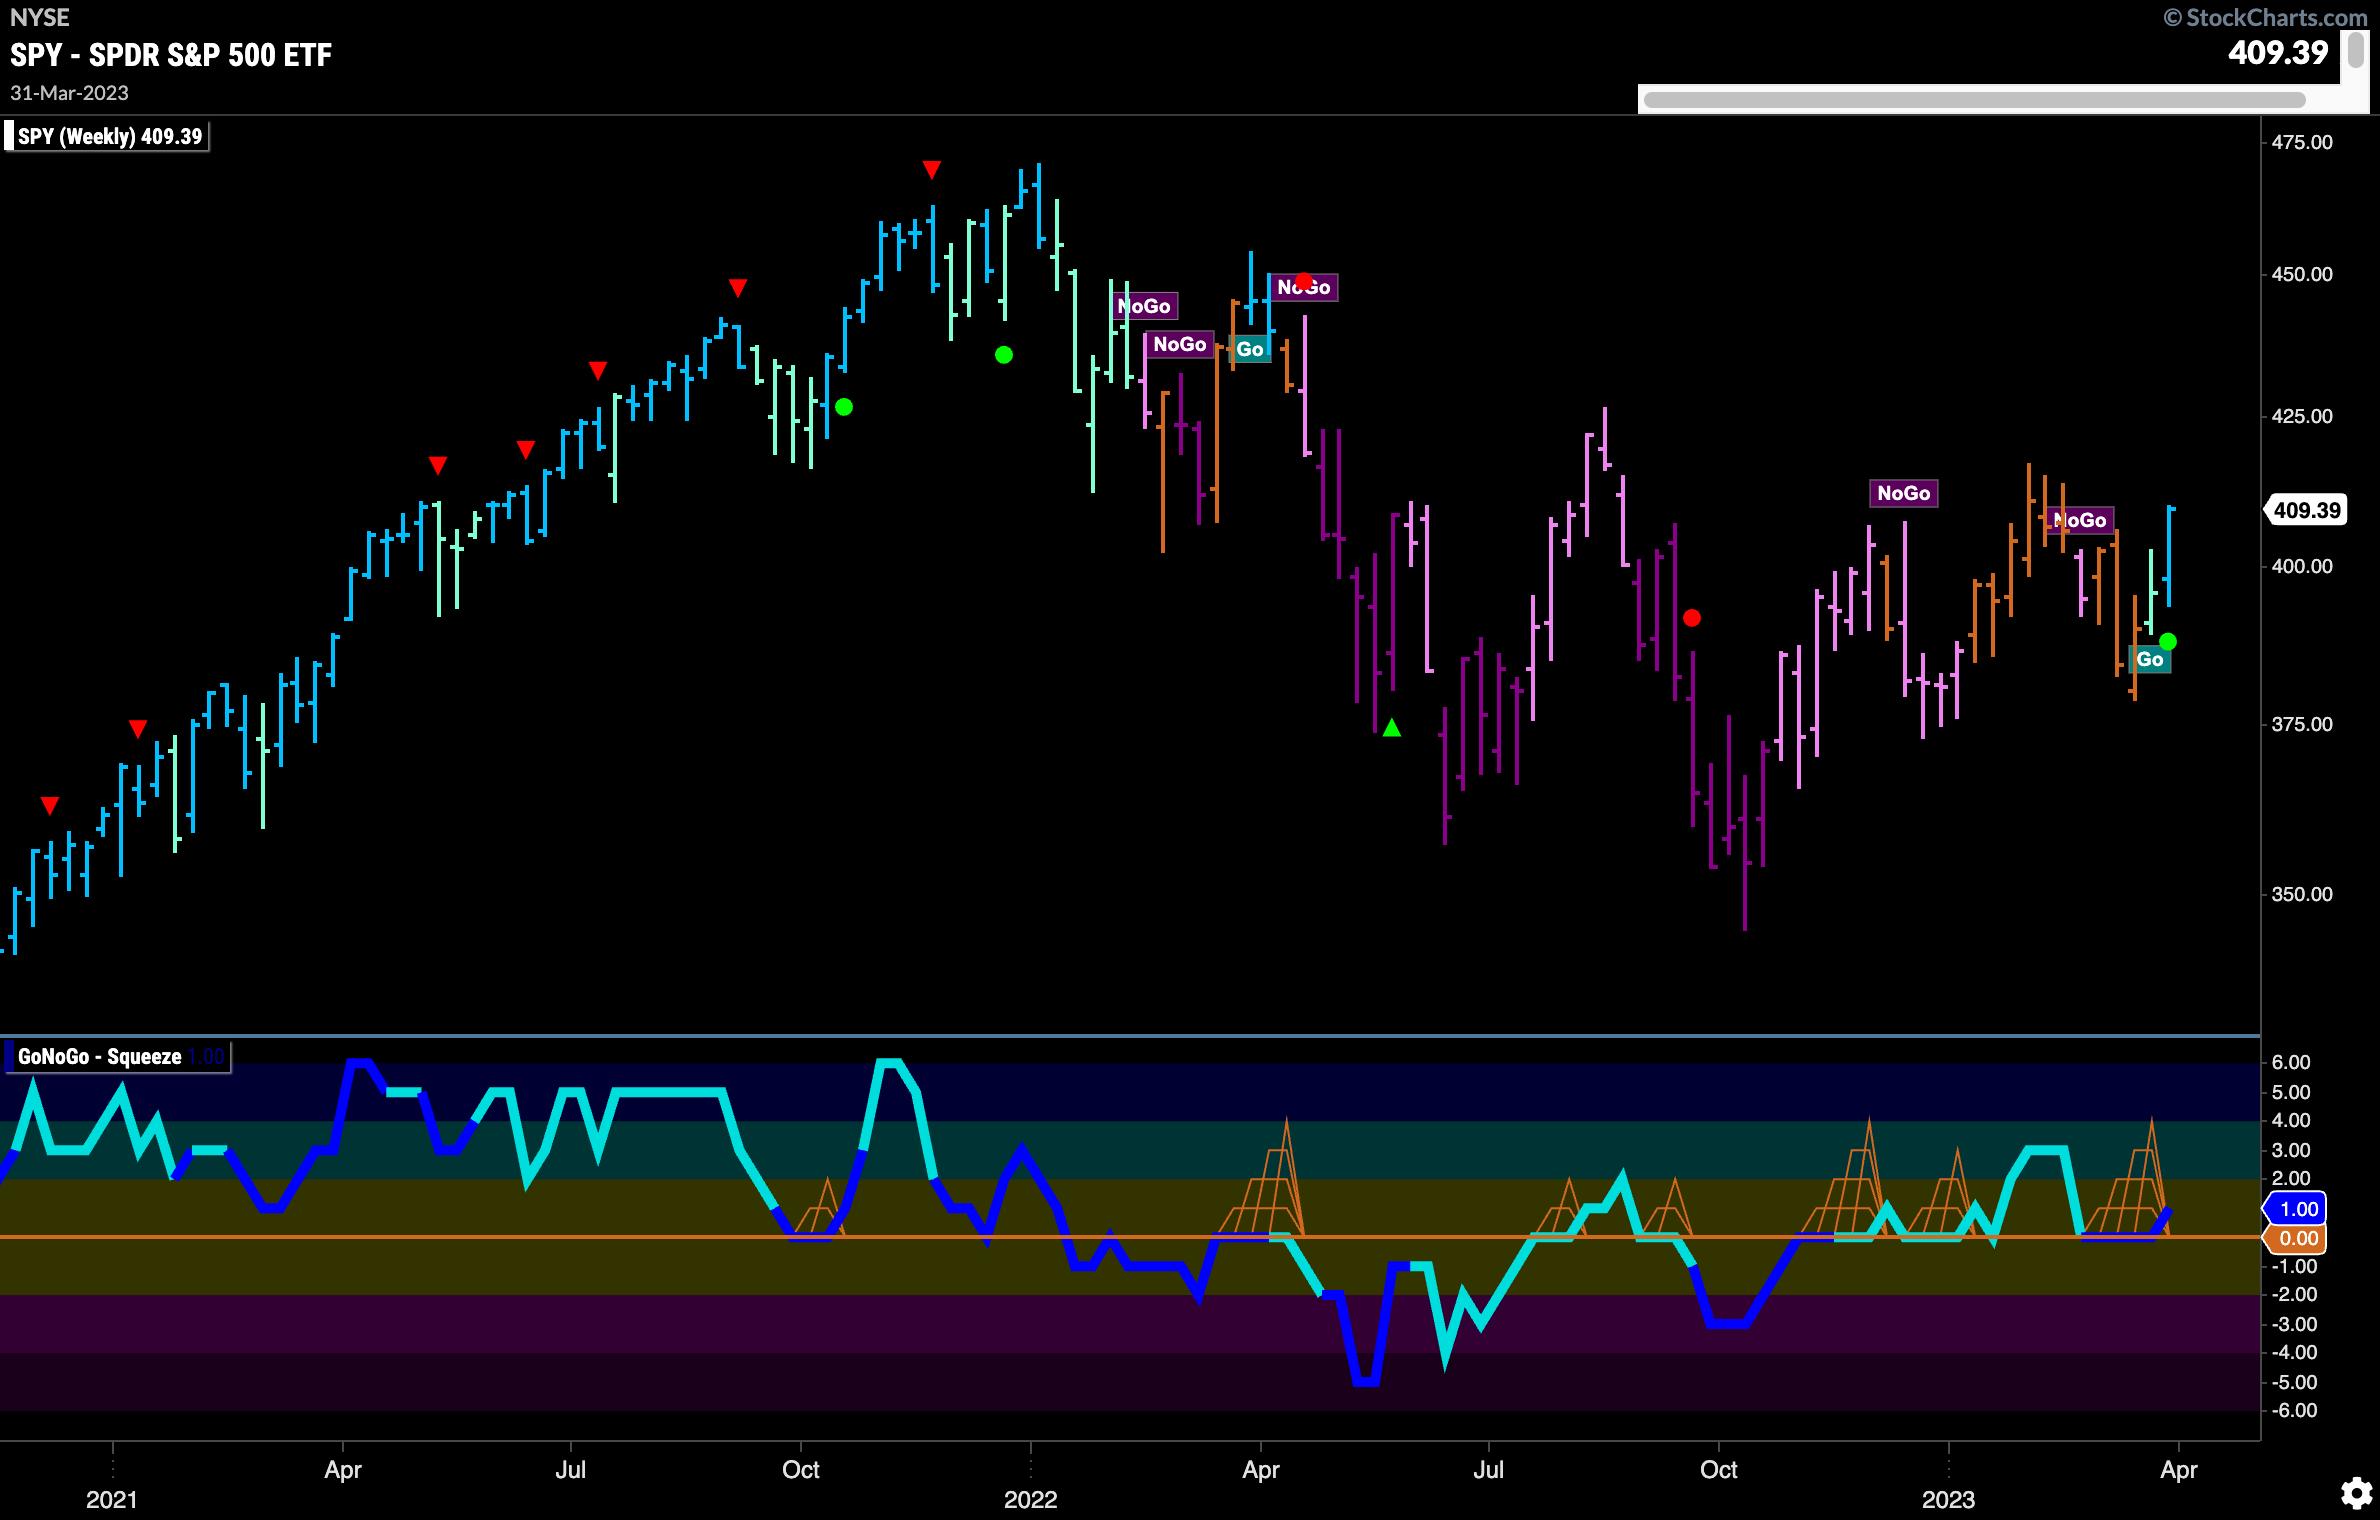
CHART 3: WEEKLY CHART OF SPY. Price could attempt a higher high over the next few weeks.Chart source: StockChartsACP. For illustrative purposes only.
Treasury Yields Remain in "NoGo"
Treasury yields continued to paint "NoGo" bars this week, albeit weaker pink ones. It has yet to retest the support levels from a week ago. GoNoGo Oscillator is now back at the zero line. It remains to be seen if it finds resistance. If it does, price could move lower in an attempt to set new lows.
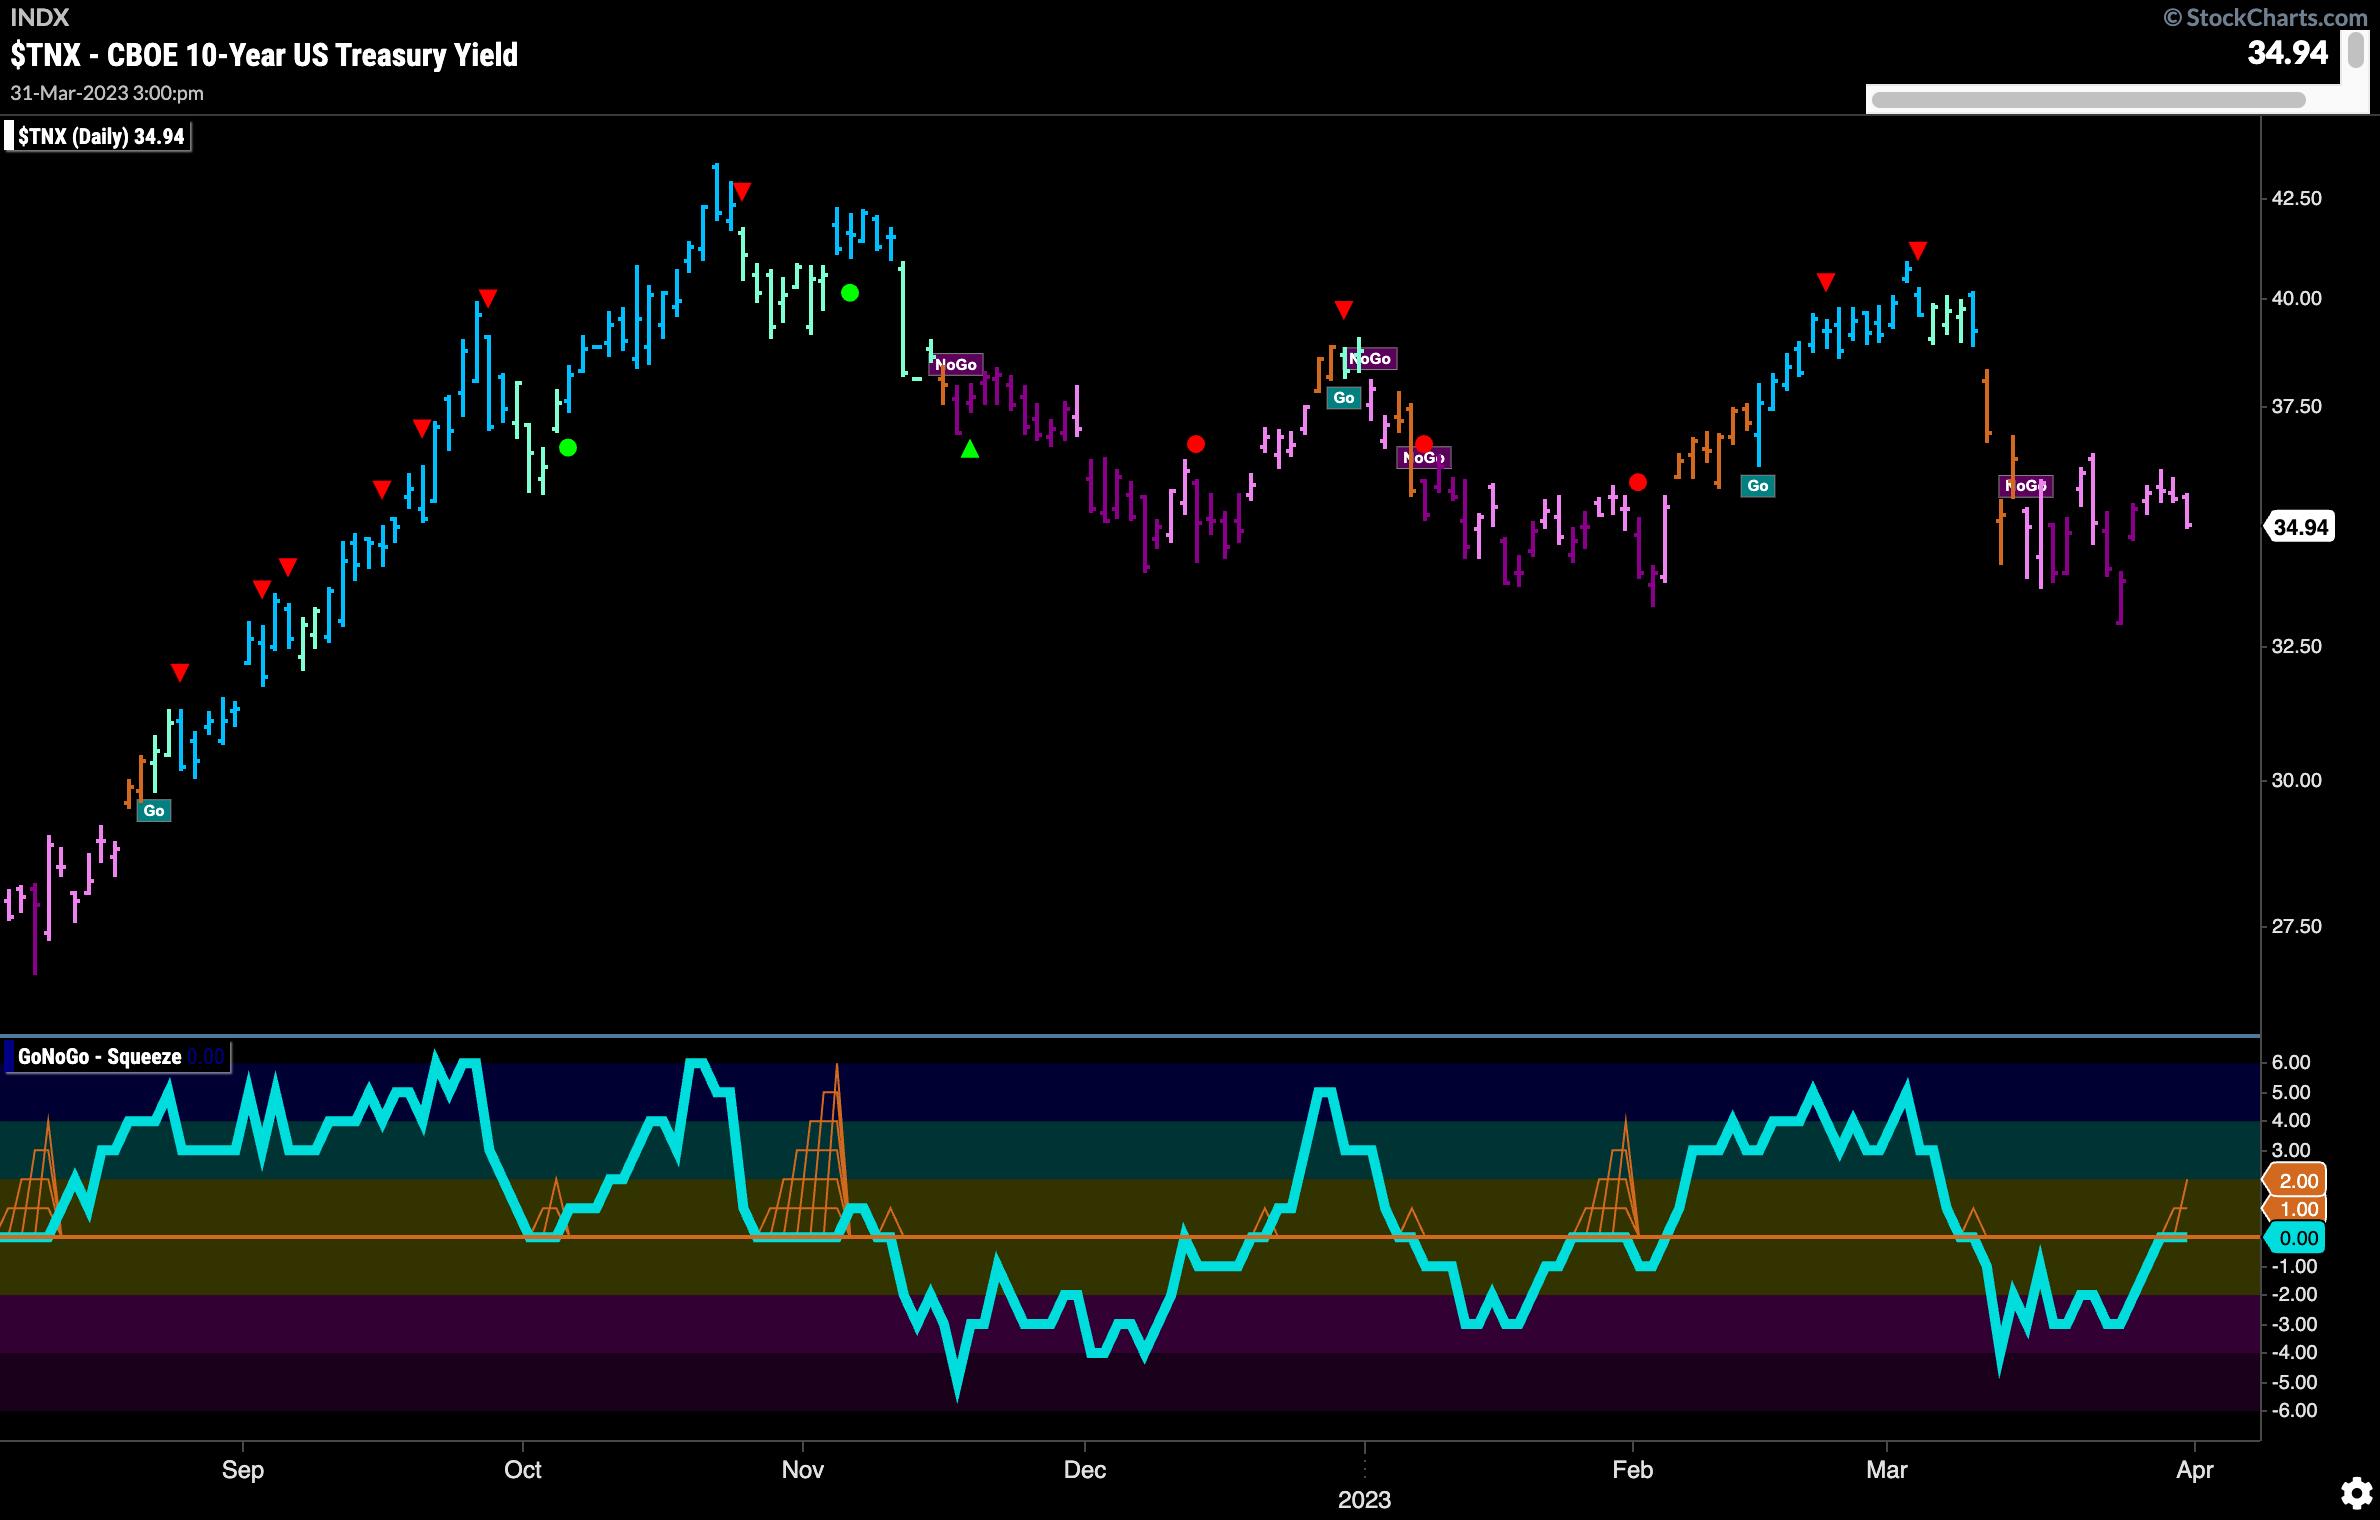
CHART 4: 10-YEAR US TREASURY YIELDS IN "NOGO" MODE. The GoNOGo Oscillator is back at the zero level, which could act as a resistance level.Chart source: StockChartsACP. For illustrative purposes only.
On the weekly chart the trend is showing uncertainty with a second consecutive amber "Go Fish" bar. GoNoGo Trend shows price has fallen out of the "Go" trend that was in place for over a year. The GoNoGo Oscillator is back below the zero line as well, indicating bearish momentum.
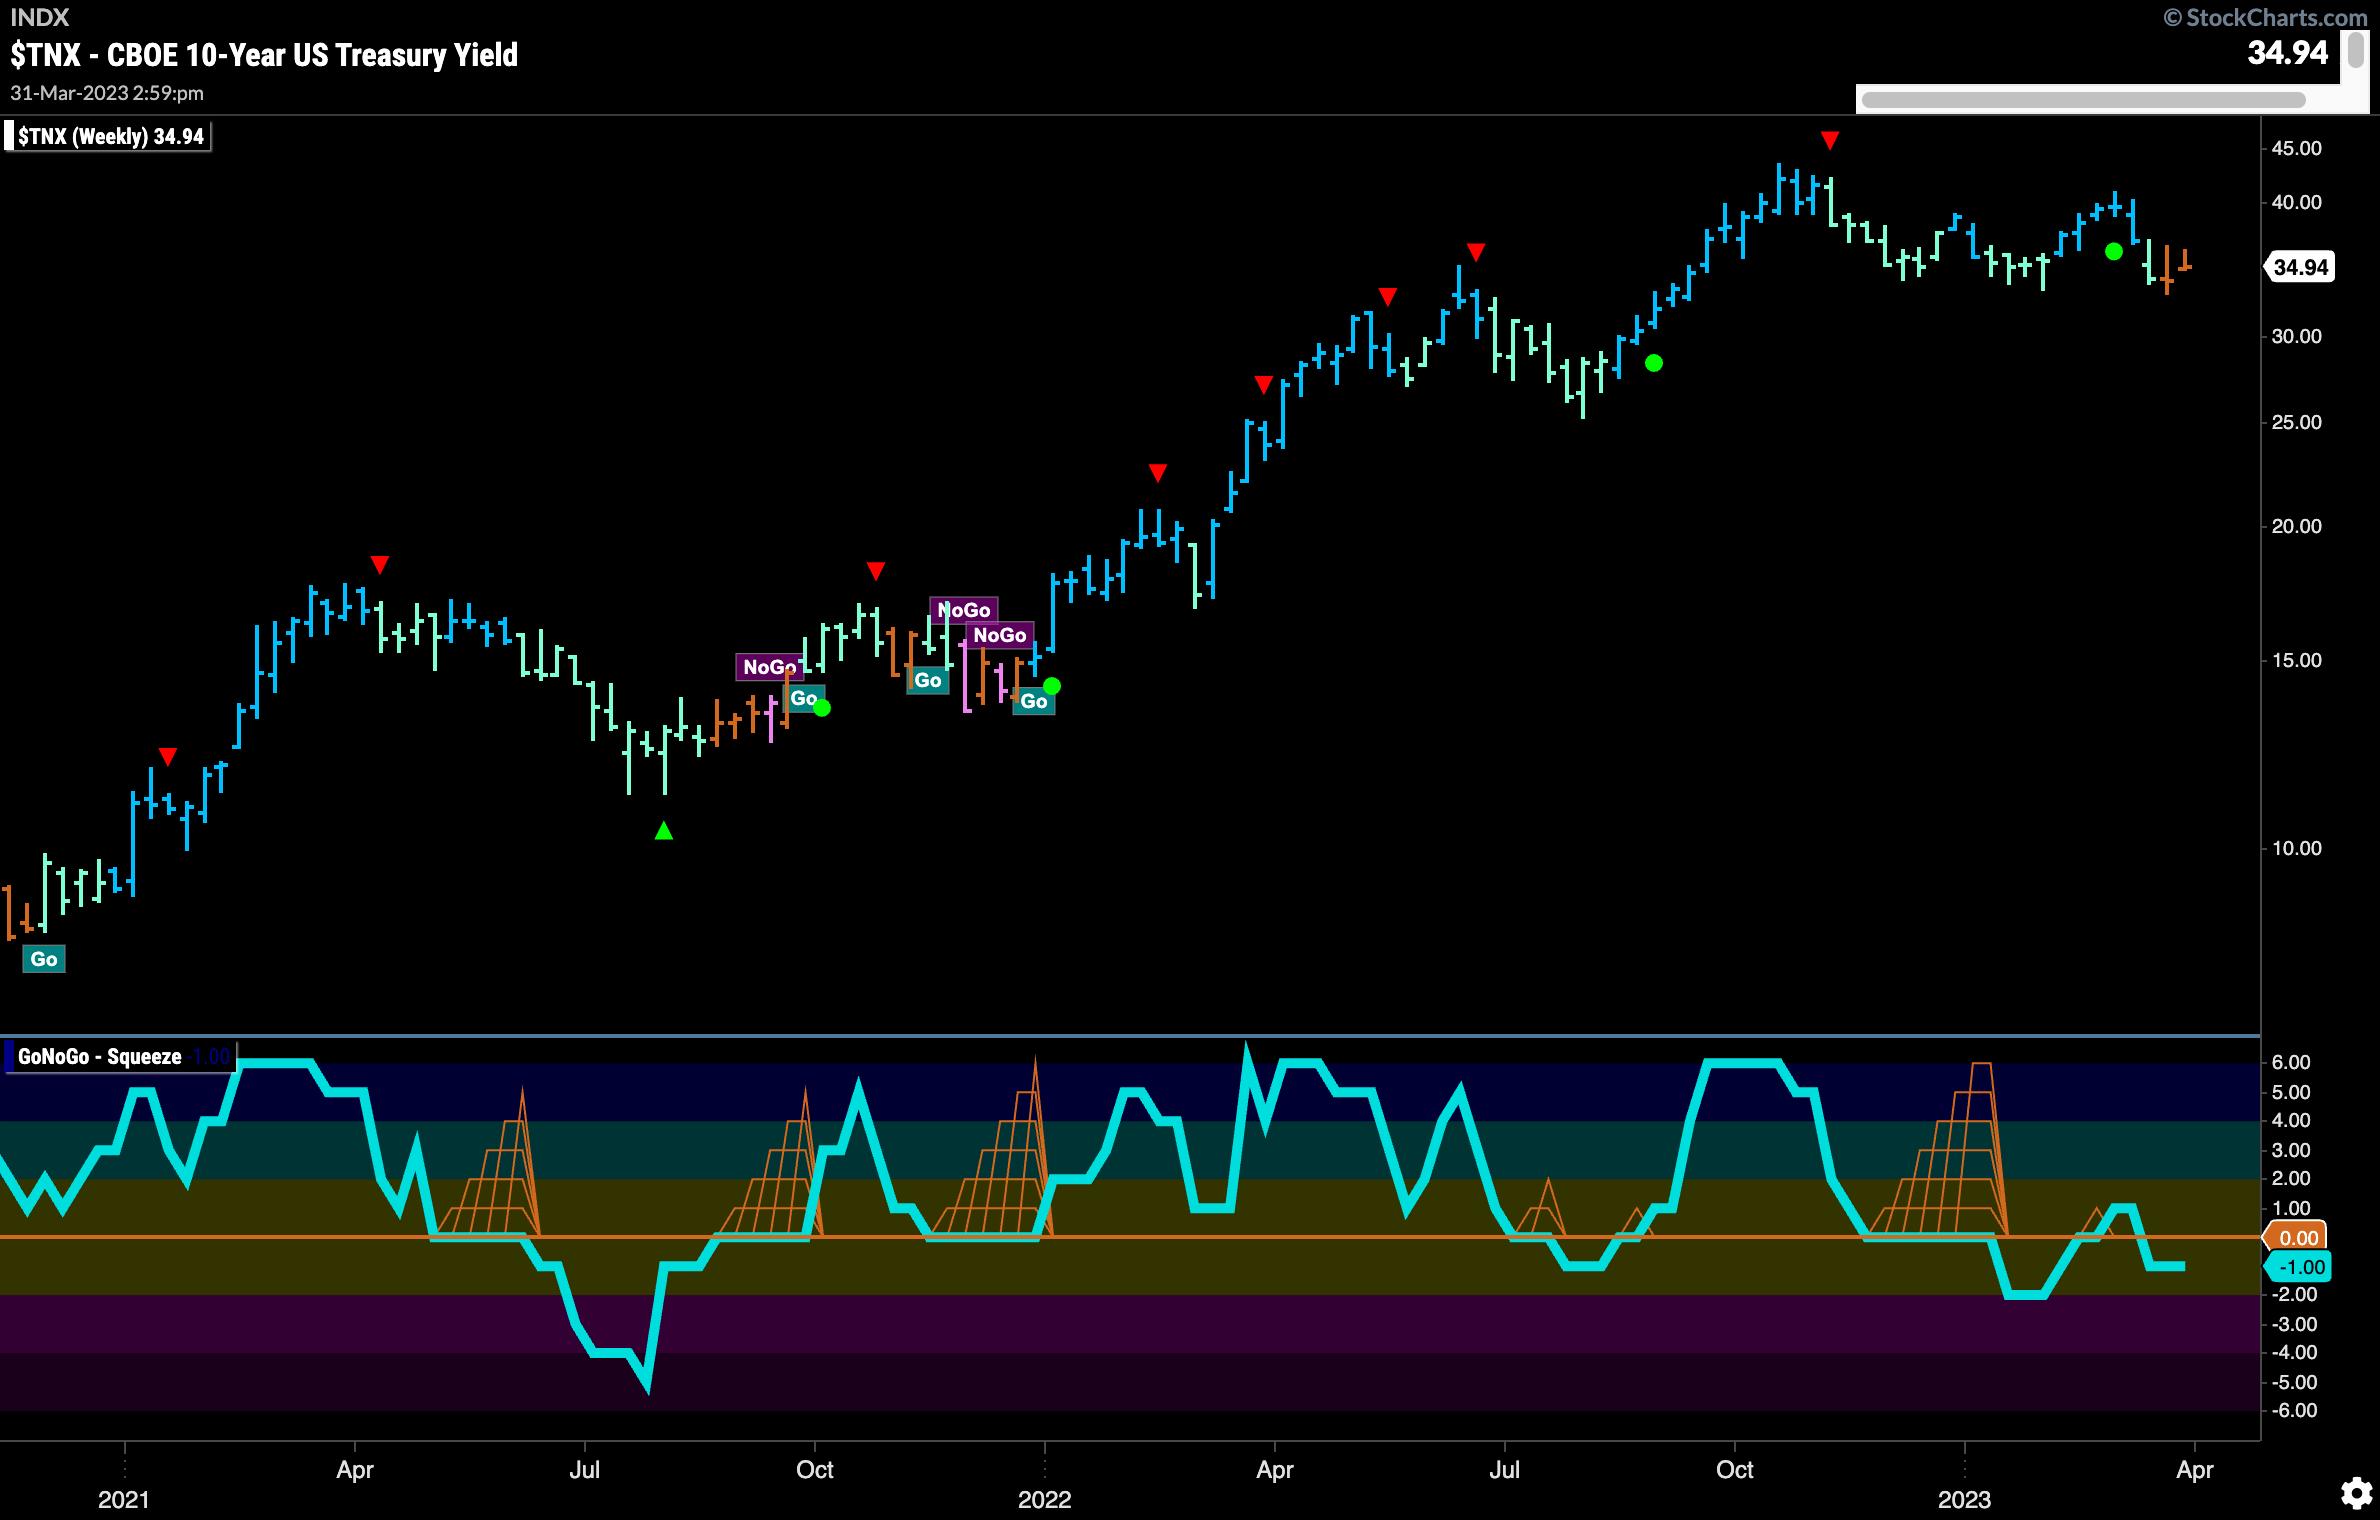
CHART 5: WEEKLY CHART OF 10-YEAR US TREASURY YIELDS. Overall, Treasury yields are indicating bearish momentum.Chart source: StockChartsACP. For illustrative purposes only.
US Dollar Sees "NoGo" Trend Strengthen
GoNoGo Trend painted stronger purple bars this week as the trend in the US dollar intensified. The GoNoGo Oscillator is in negative territory, but not oversold. Look for this trend to continue as price looks to approach prior lows.
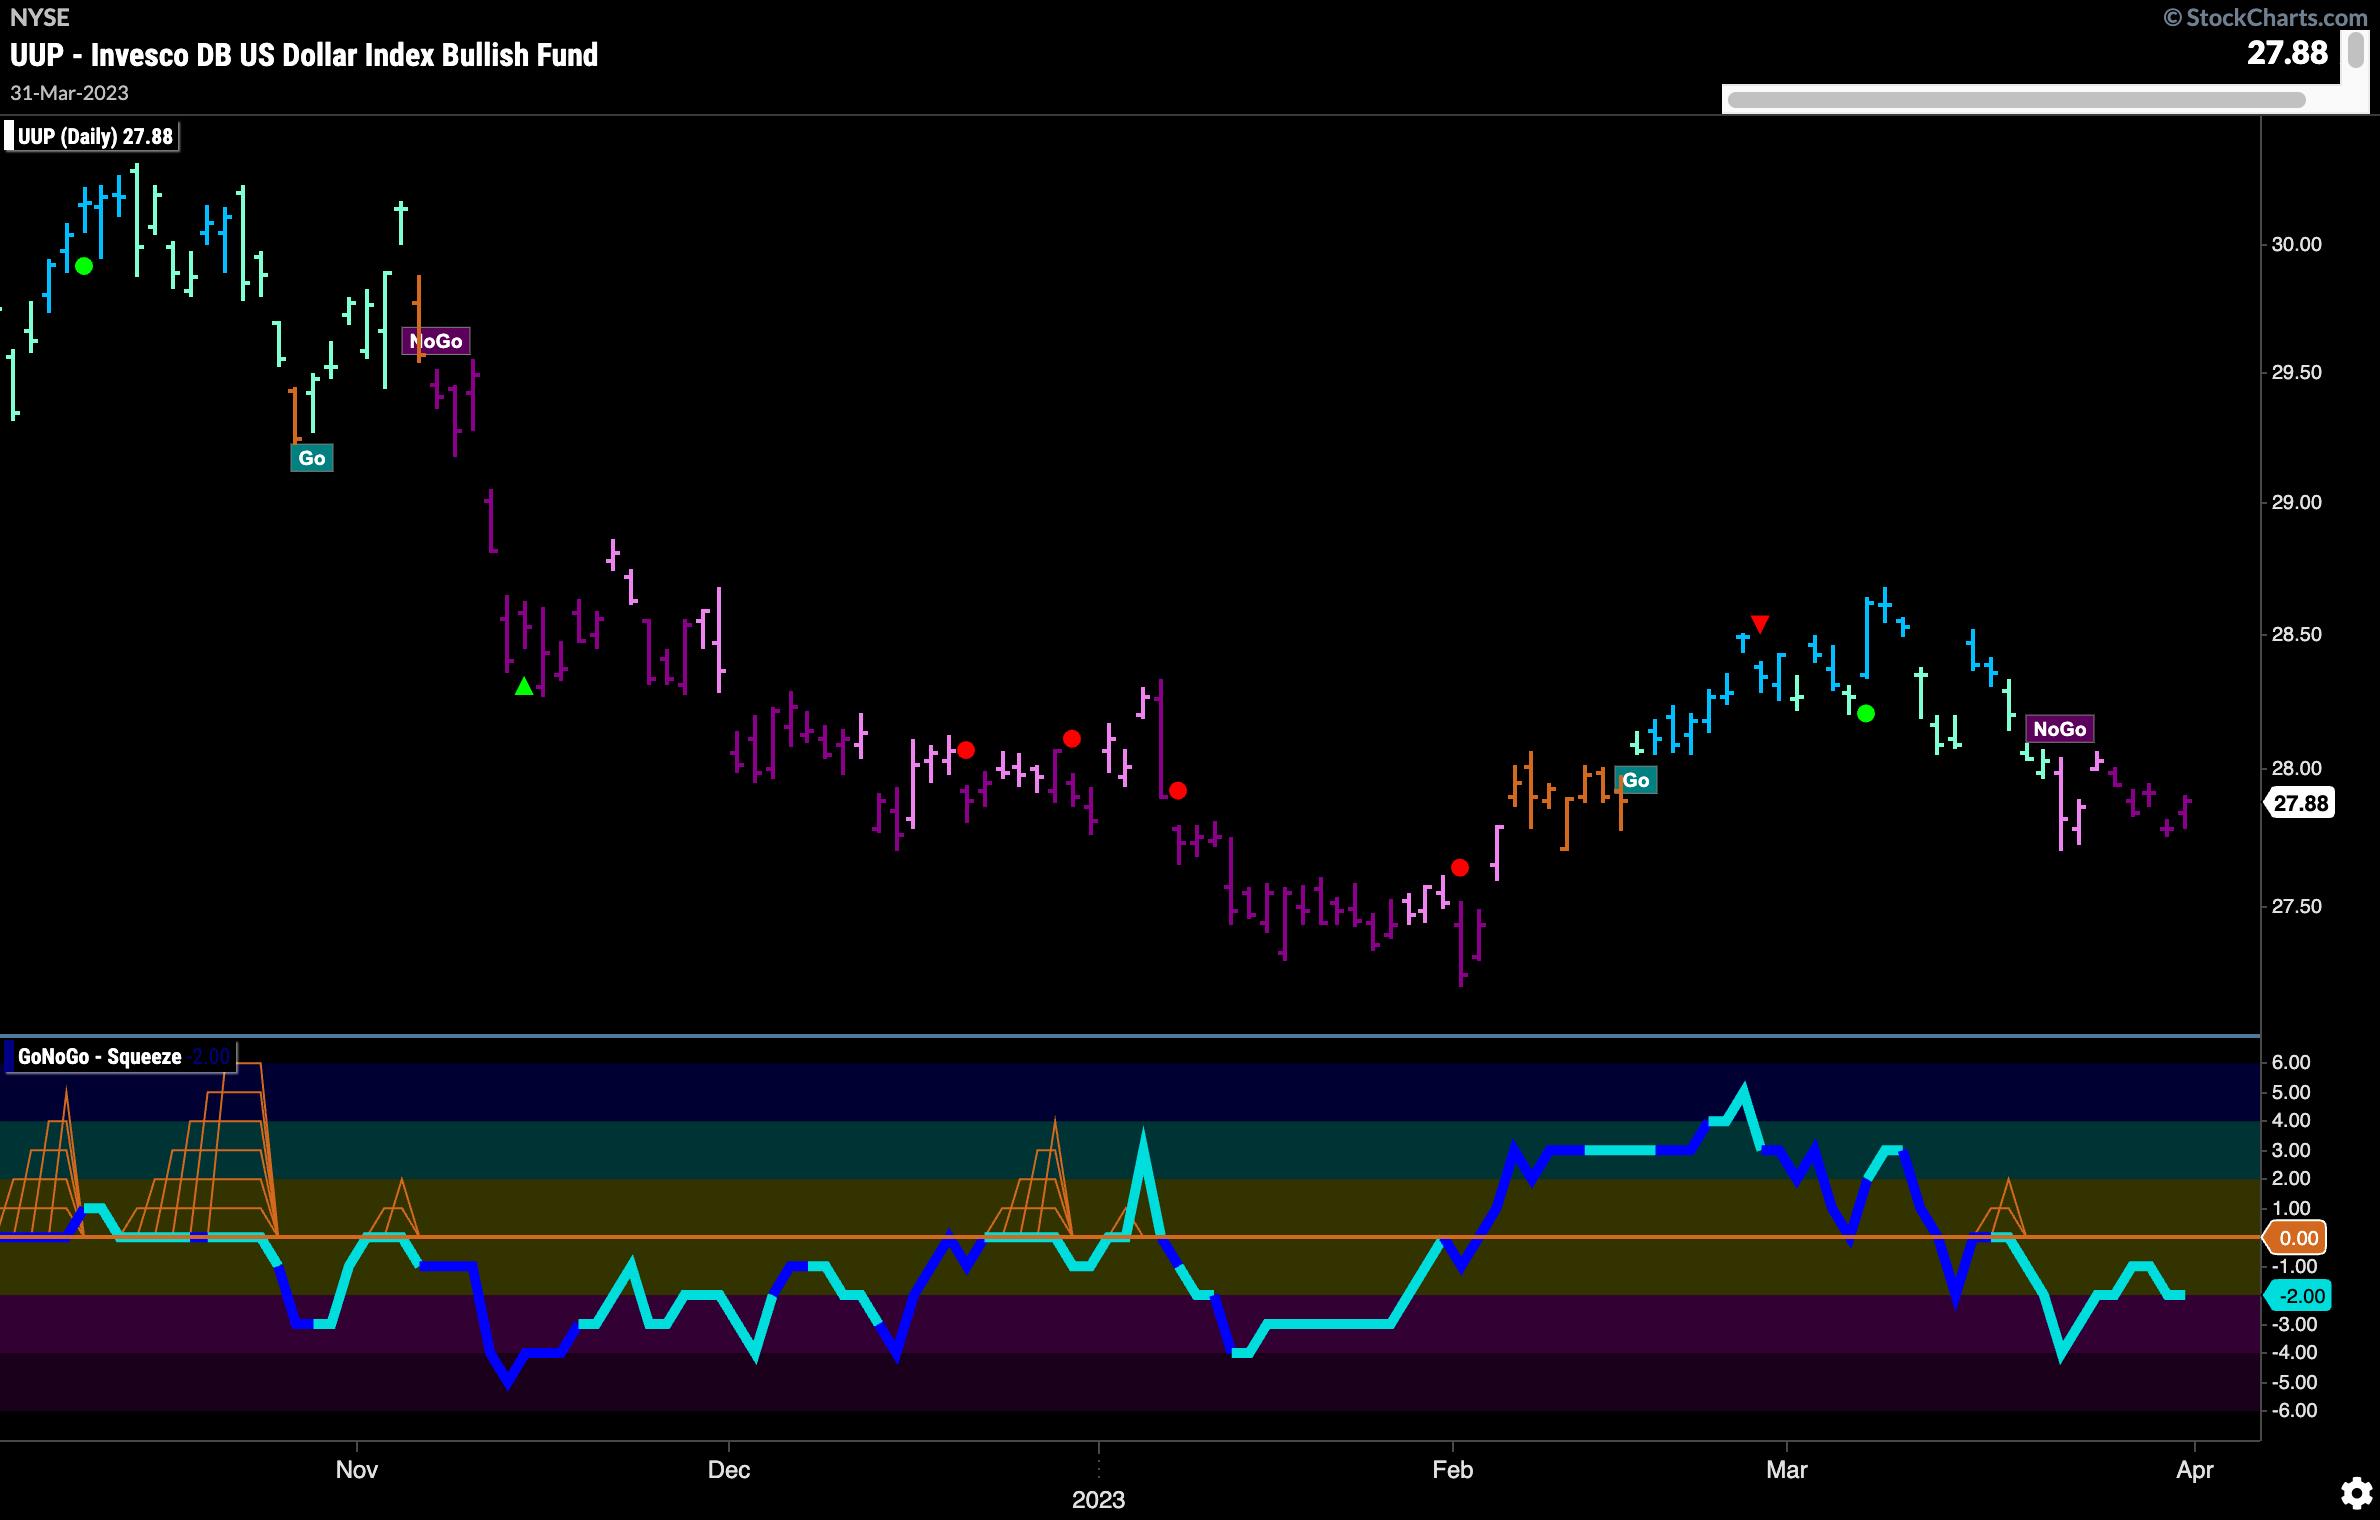
CHART 6: INVESCO DB US DOLLAR INDEX BULLISH FUND (UUP) DAILY CHART. The trend is down and will likely continue as price looks to hit prior lows.Chart source: StockChartsACP. For illustrative purposes only.
The weekly chart shows that the larger timeframe trend is still a "NoGo". Painting another strong purple "NoGo" bar, you can see that GoNoGo Trend is sure of the current trend. The GoNoGo Oscillator is riding the zero line for another week as the climbing grid of GoNoGo Squeeze climbs to its max. It's worth watching to see in which direction the squeeze is broken.
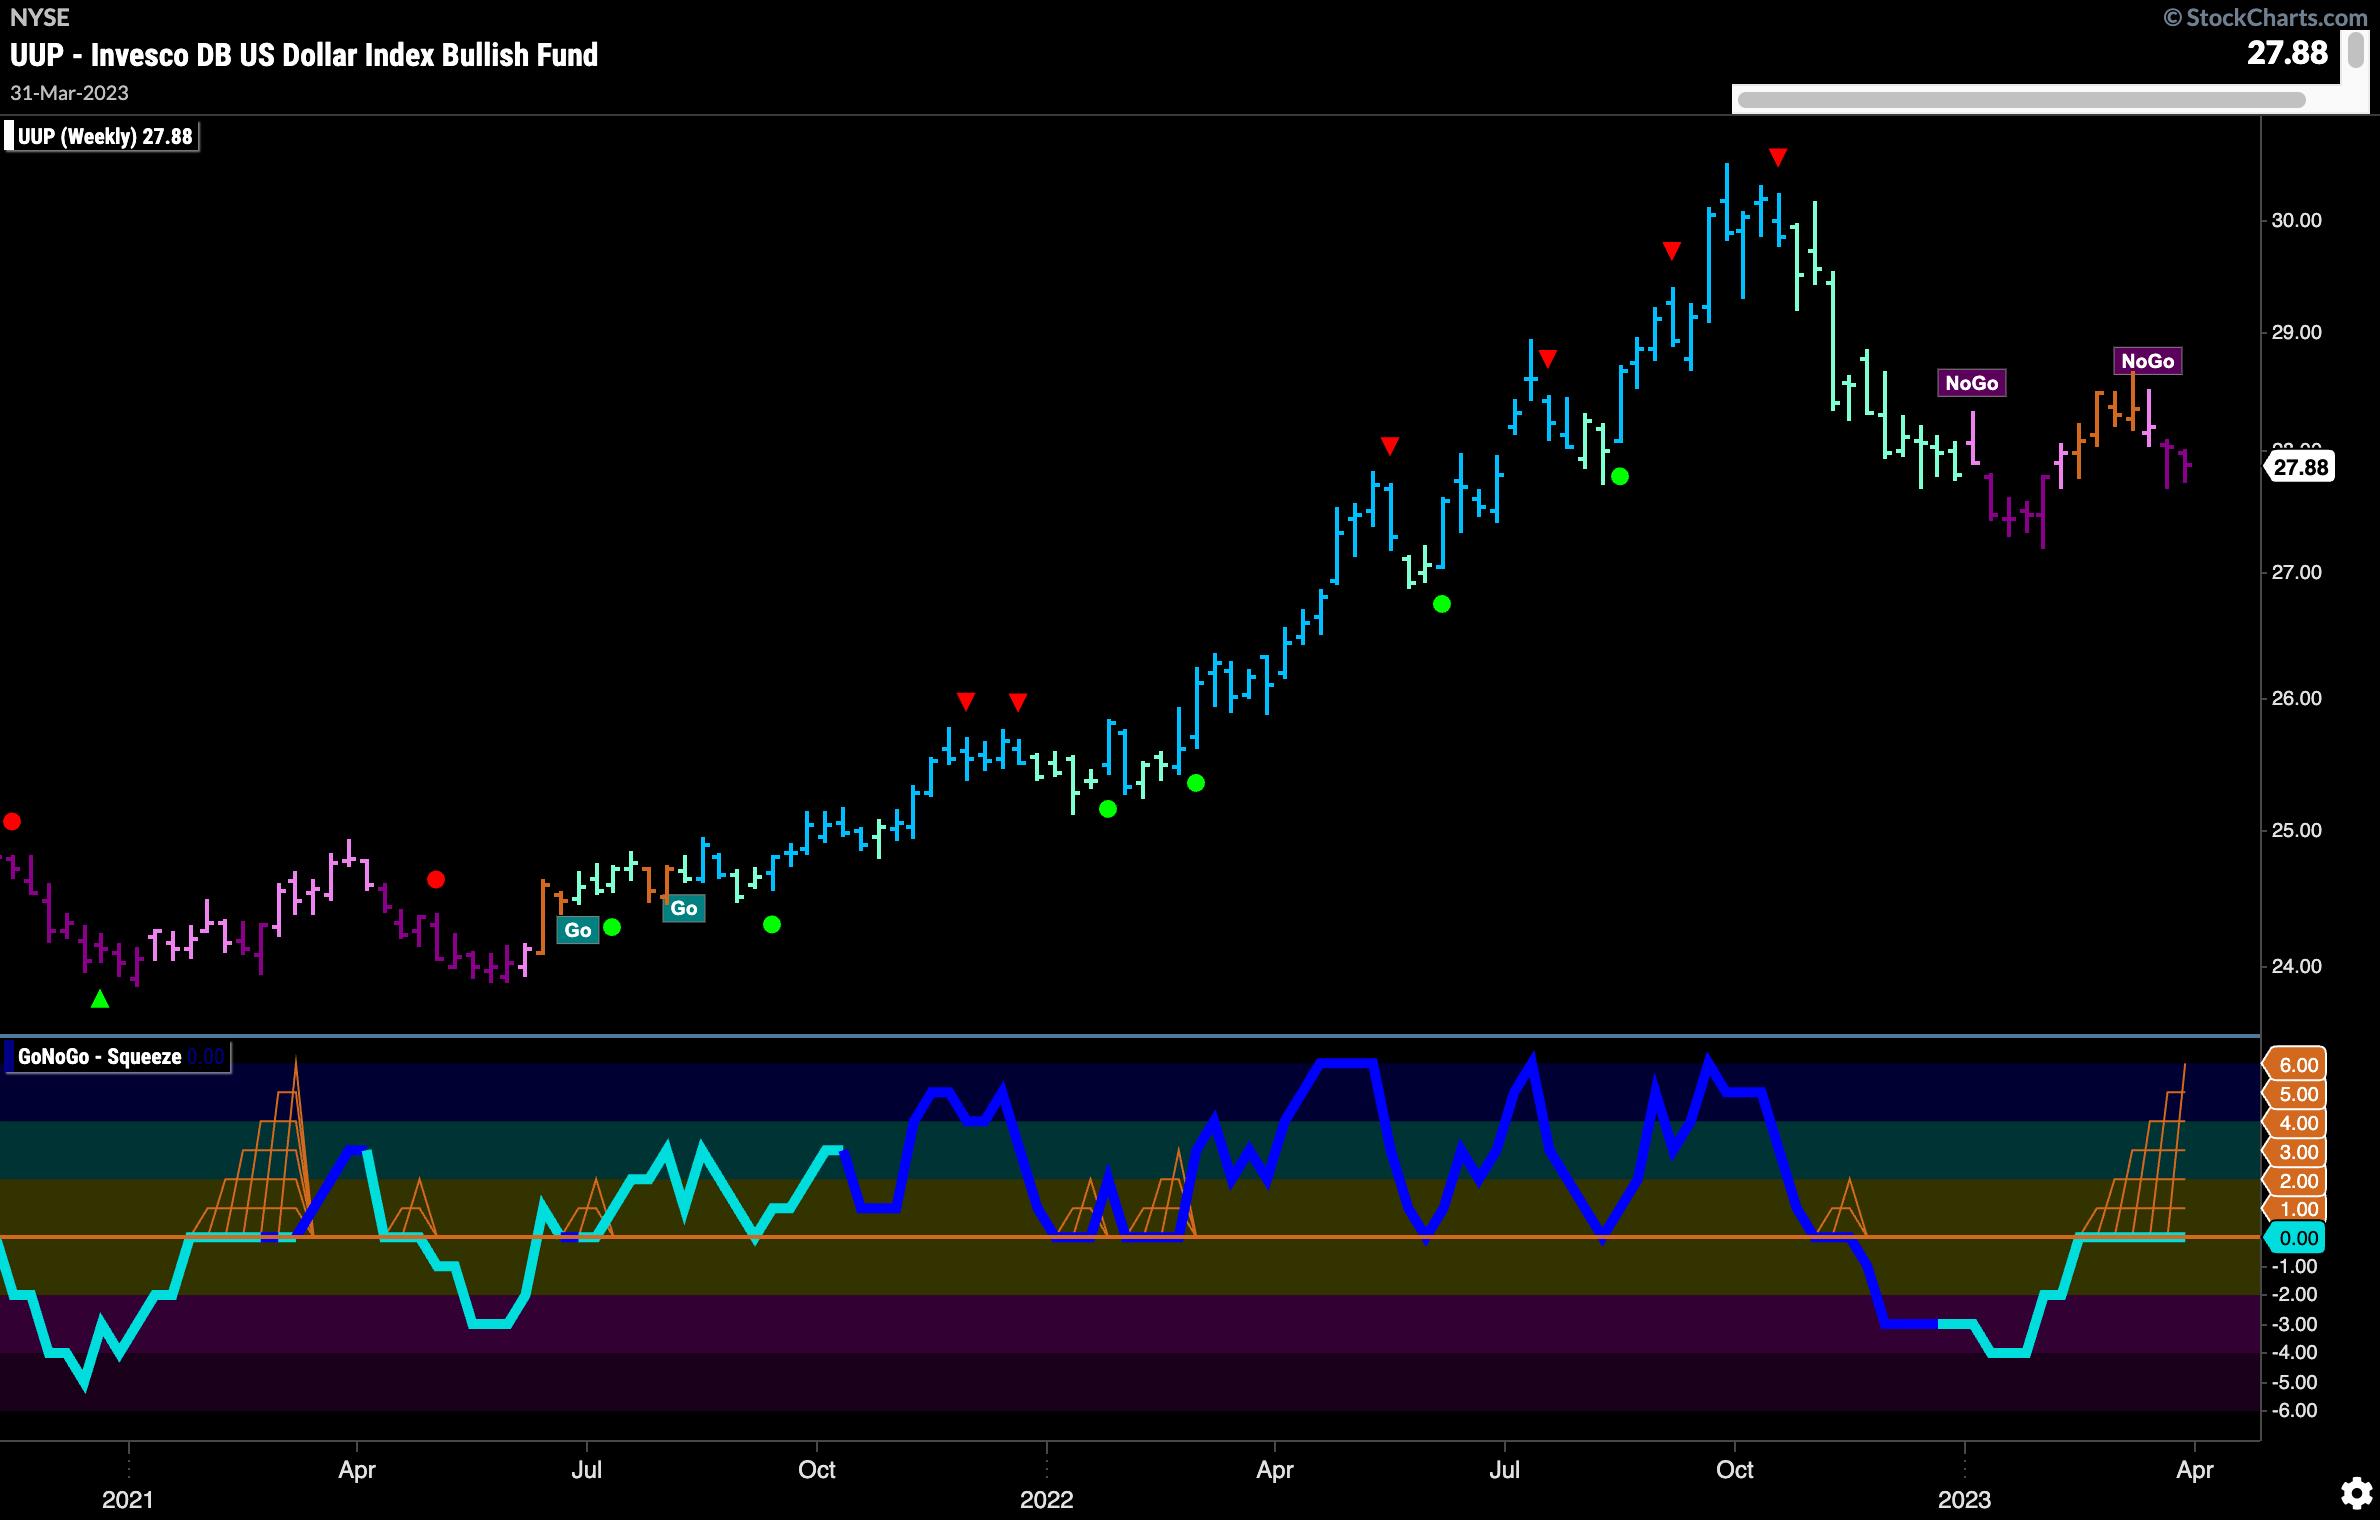
CHART 7: WEEKLY CHART OF UUP SHOWS "NOGO" STRENGTHENED. The US dollar continues to decline on the weekly time frame. The GoNoGo Squeeze Oscillator is at the zero line.Chart source: StockChartsACP. For illustrative purposes only.
Oil Remains in Strong "NoGo" Trend
The United States Oil Fund ETF (USO) sees its GoNoGo Trend paint another strong purple "NoGo" bar even as price rallied last week. Well below prior highs, the trend remains in place. The GoNoGo Oscillator has again risen to test the zero line from below on heavy volume. Will this level act as resistance? Something to keep an eye on.

CHART 8: OIL PRICES MAY TREND LOWER. Keep an eye on the GoNoGo Oscillator's resistance level at zero.Chart source: StockChartsACP. For illustrative purposes only.
Gold Consolidates Gains
SPDR Gold Shares ETF (GLD) saw more "Go" bars this week, as price moved mostly sideways since making a new high. Price is consolidating above prior highs from January, and the GoNoGo Oscillator has been in positive territory since the new trend emerged. Now, it's testing the zero line from above. The question is if it'll find support at the zero line.
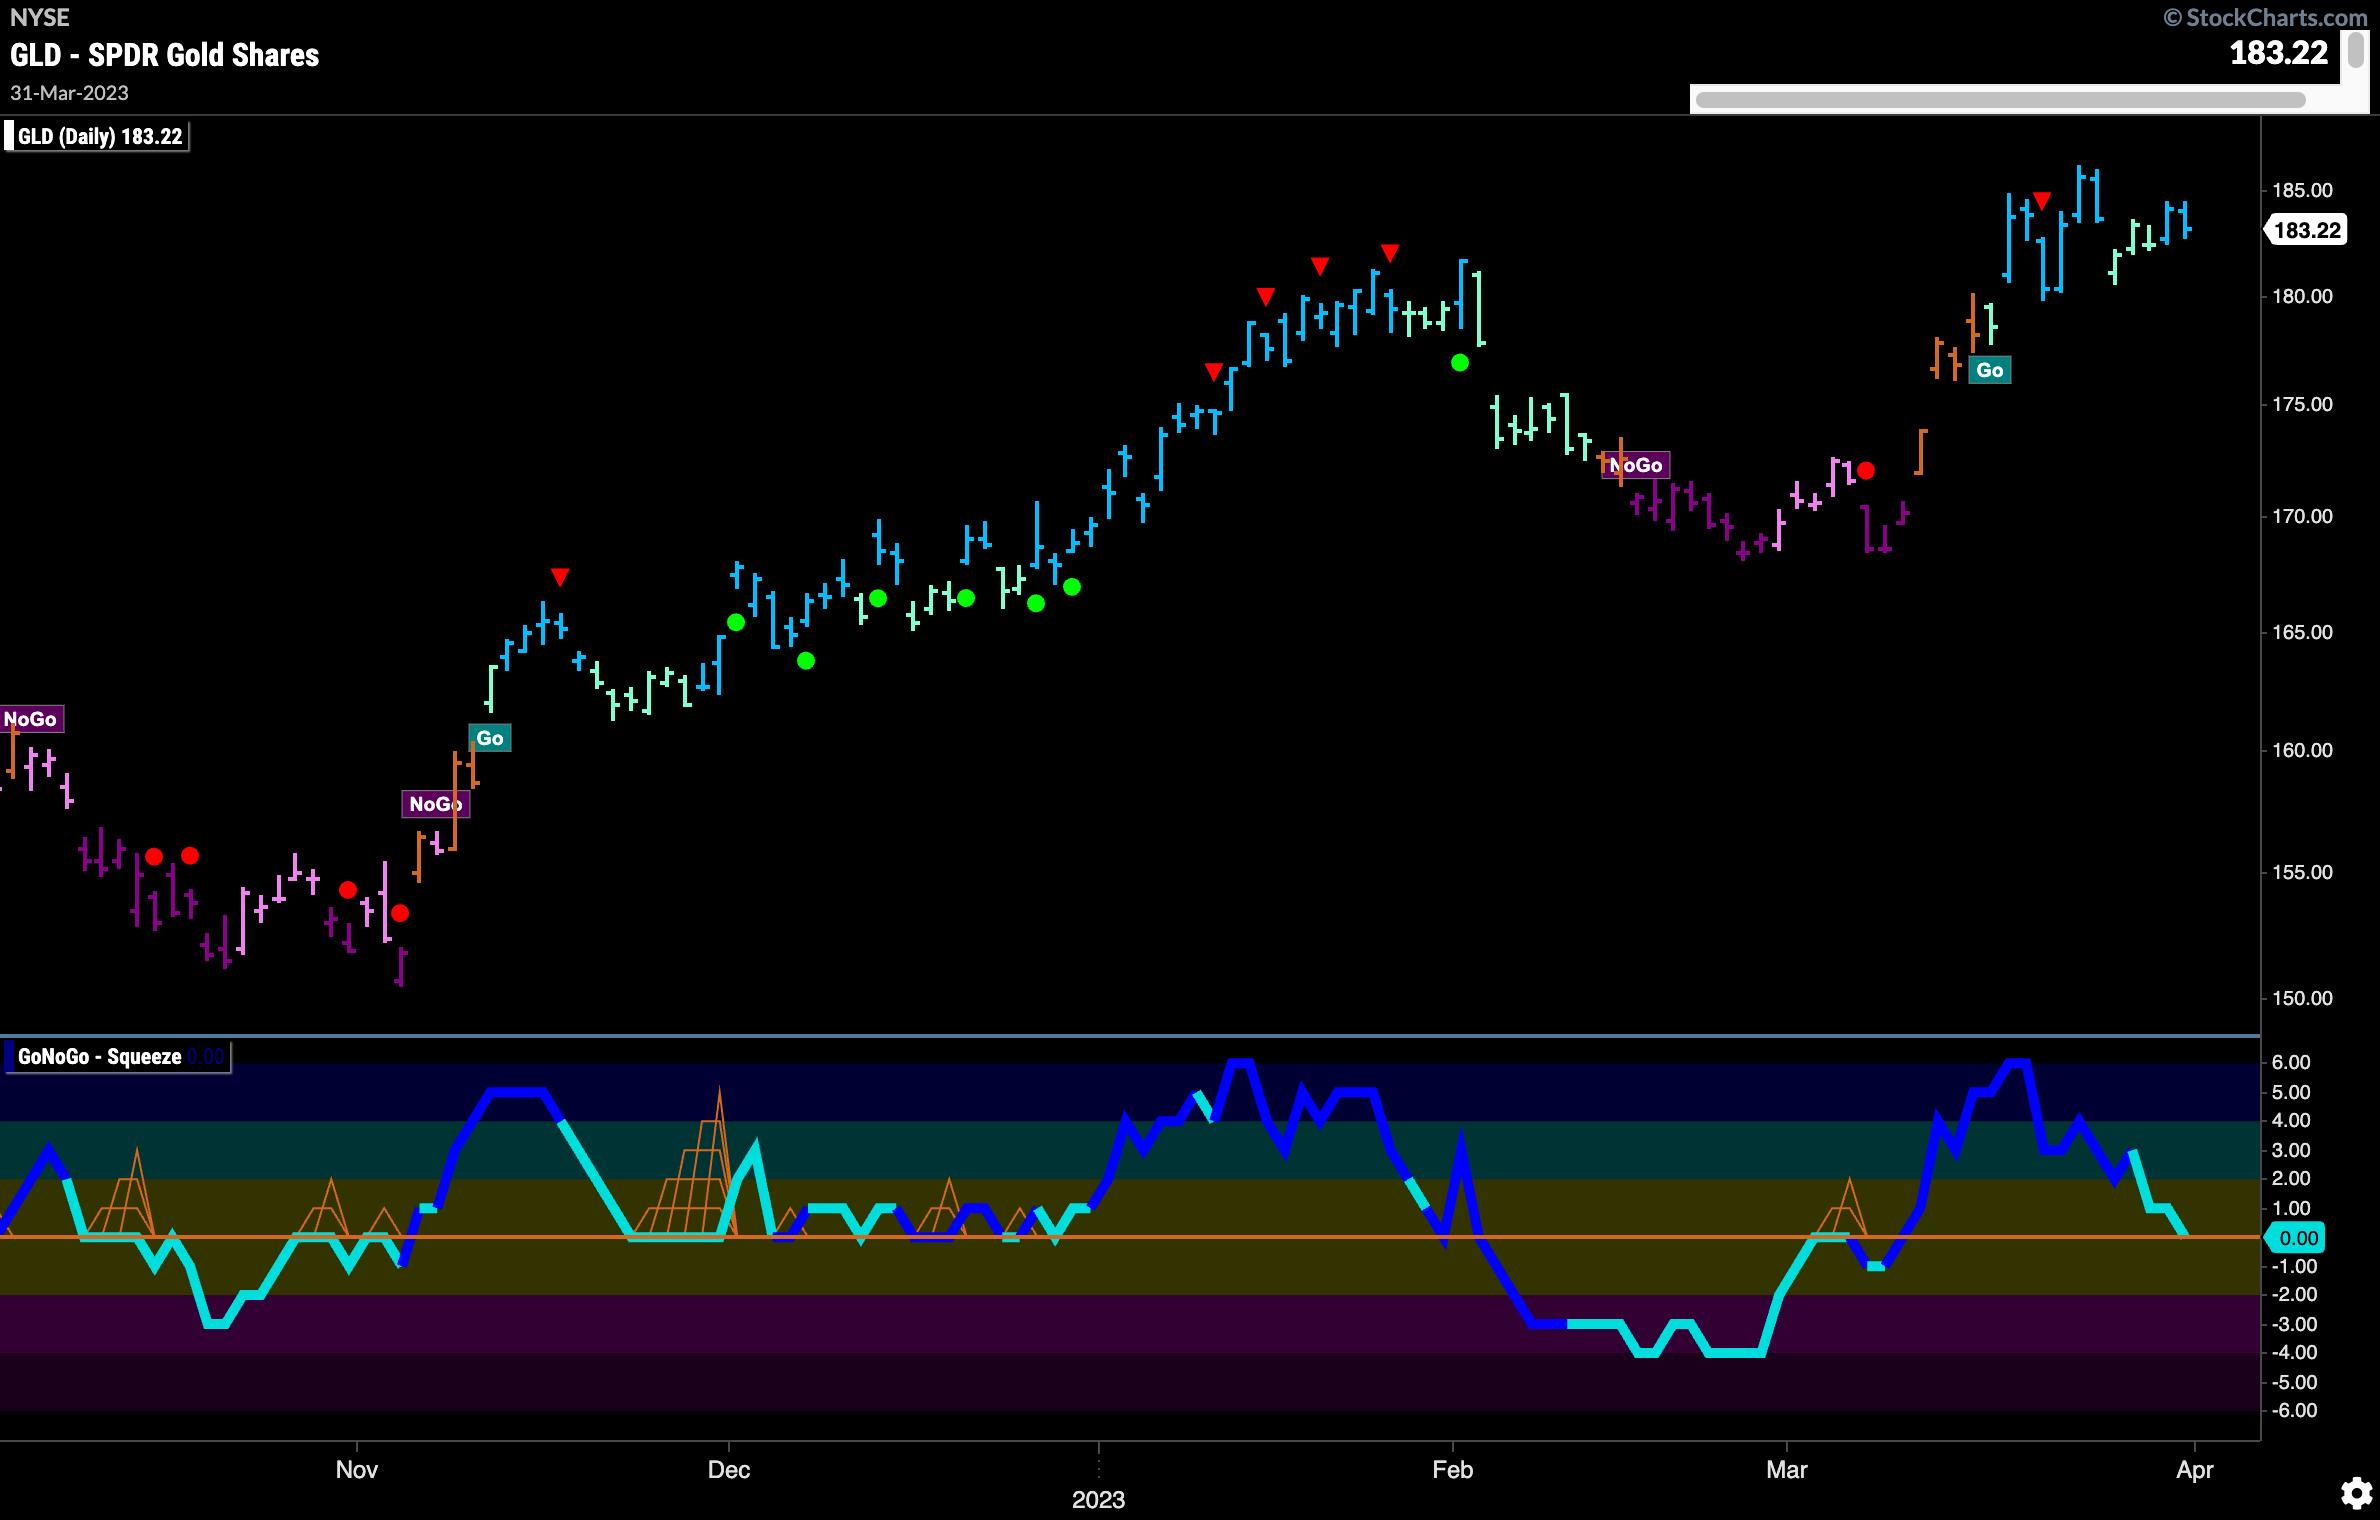
CHART 9: GOLD LOOKS TO BE CONSOLIDATING. Look to see if price action finds support at the GoNoGo Oscillator zero line.Chart source: StockChartsACP. For illustrative purposes only.
Sector RelMap
Below is the GoNoGo Sector RelMap. This GoNoGo RelMap applies the GoNoGo Trend to the relative strength ratios of the sectors to the base index. Looking at this map, you can see where the relative outperformance is coming from and which sectors are lagging on a relative basis. Three sectors are outperforming the base index this week—$XLK, $XLC, and $XLP are painting "Go" bars.
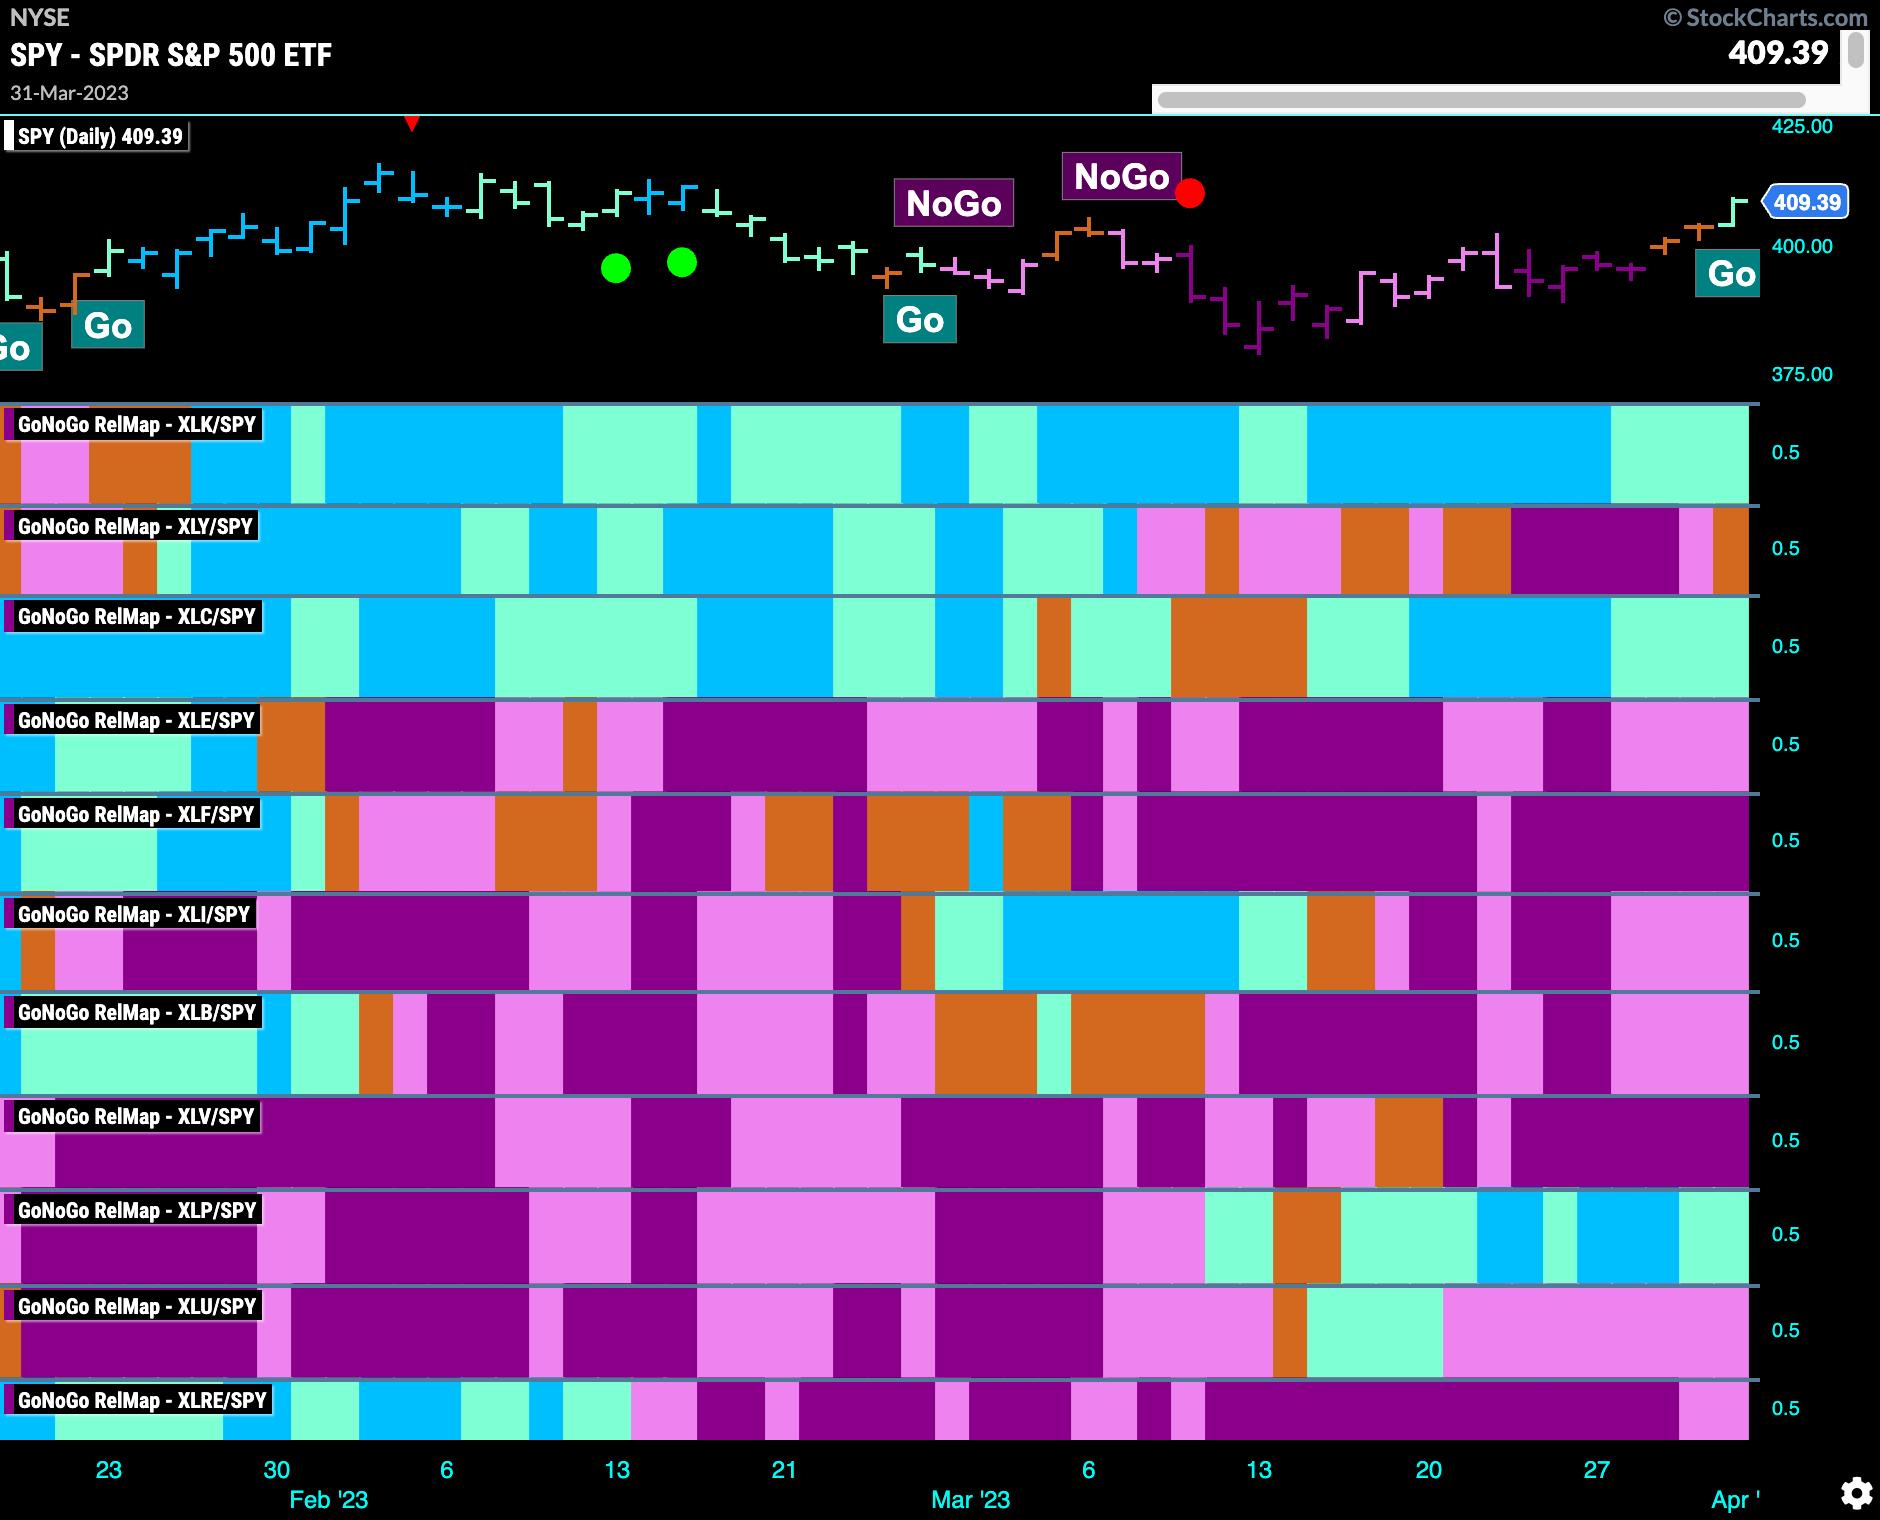
CHART 10: WHICH SECTORS ARE LEADING AND/OR LAGGING? The GoNoGo RelMap shows that this week, three sectors, Technology, Communications Services, and Consumer Staples, outperform the base index. Chart source: StockChartsACP. For illustrative purposes only.