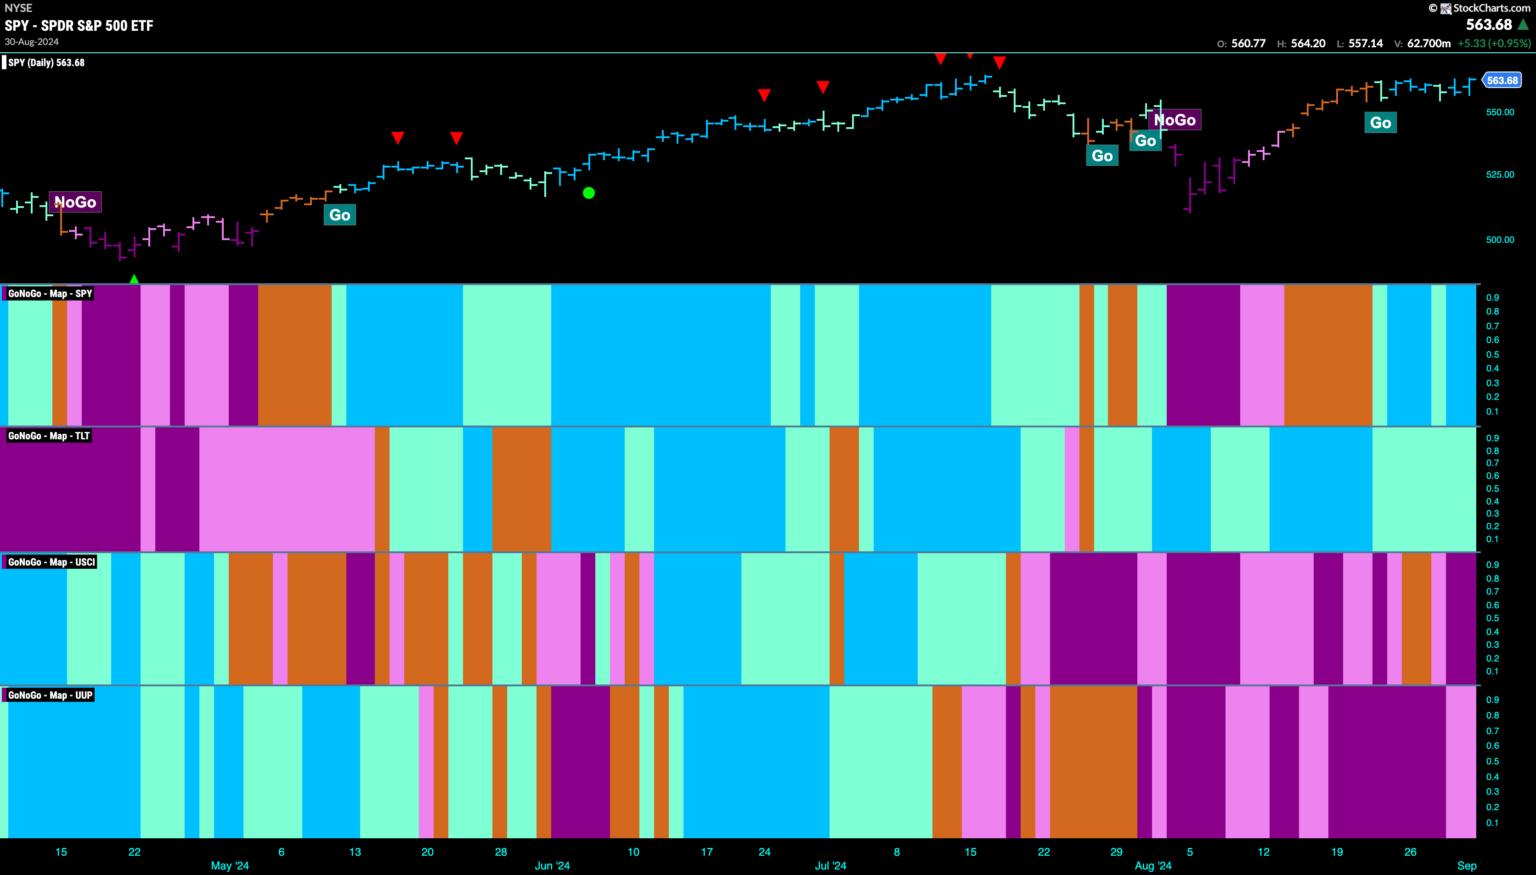
Good morning and welcome to this week's Flight Path. Equities consolidated their new "Go" trend this week. We see that the indicator painted mostly strong blue bars even as price moved mostly sideways. Treasury bond prices remained in a "Go" trend but painted an entire week of weaker aqua bars. U.S. commodity index fell back into a "NoGo" after we had seen a few amber "Go Fish" bars and ended the week painting strong purple bars. The dollar, which had been showing "NoGo" strength ended the week painting weaker pink bars.
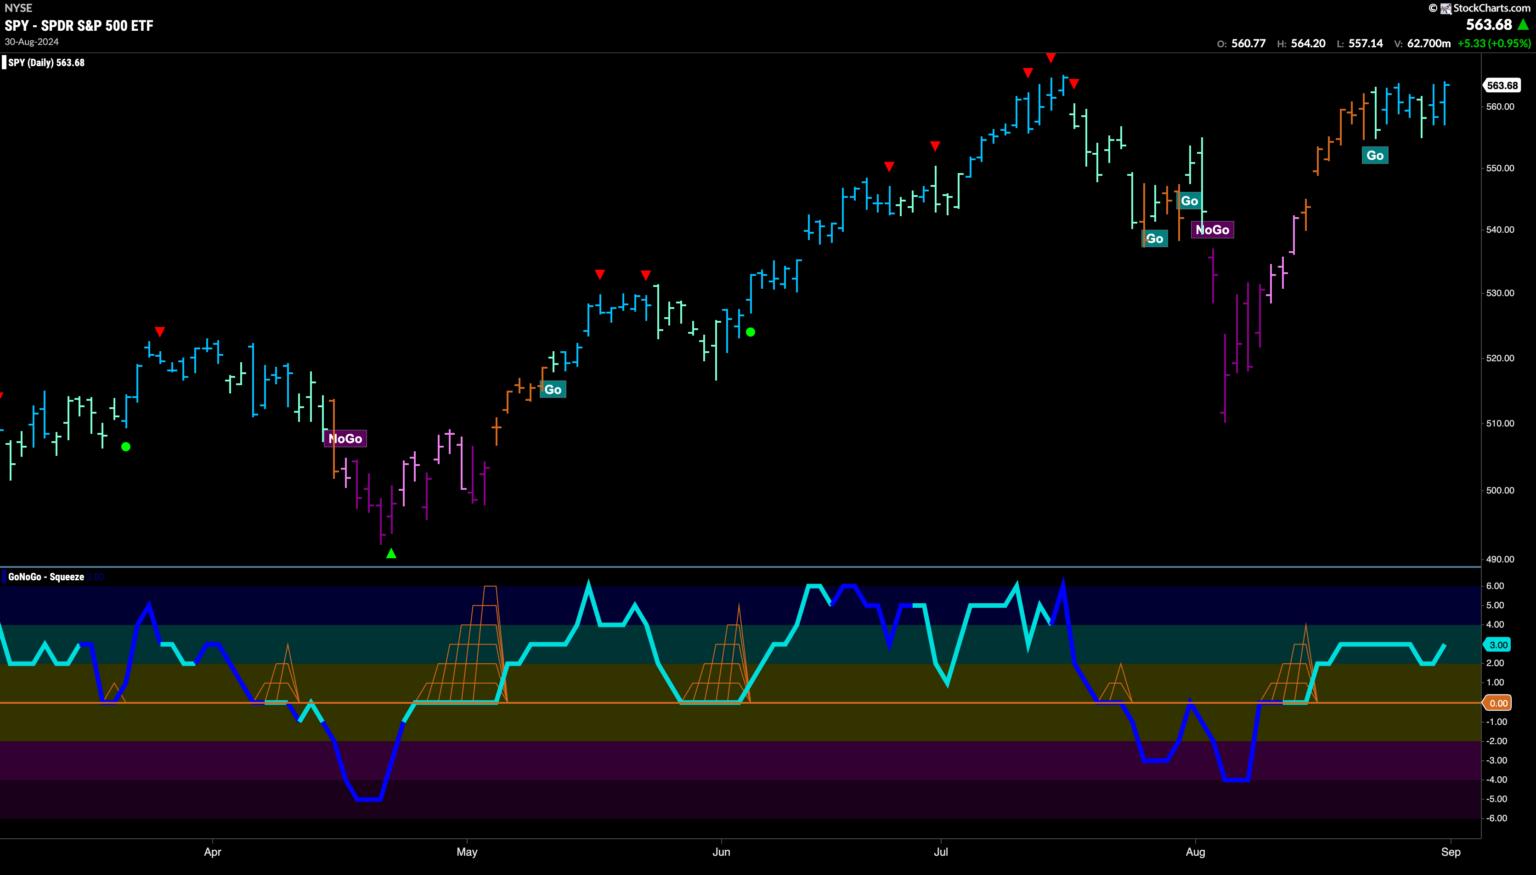
$SPY Consolidates in "Go" Trend
The GoNoGo chart below shows that after entering a new "Go" trend just over a week ago, price has consolidated and moved mostly sideways. GoNoGo Trend has been able to paint "Go" bars with a sprinkling of weaker aqua in the mix. The end of the week saw strong blue bars return and price toward the top of the range. GoNoGo Oscillator is in positive territory at a value of 3. With momentum on the side of the "Go" trend and not yet overbought, we will watch to see if price can challenge for new highs this week.
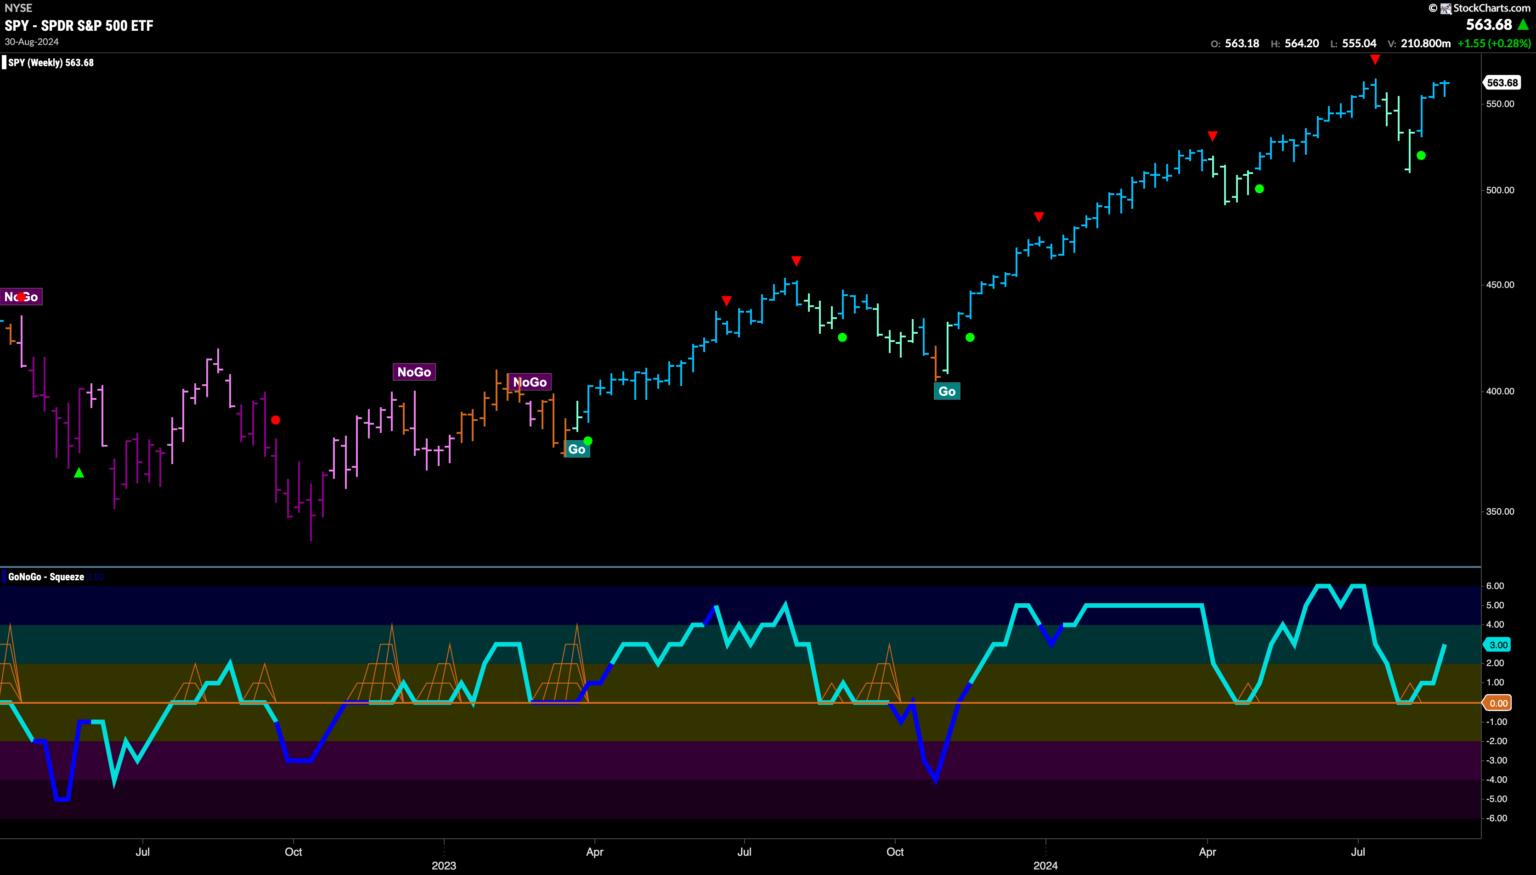
The longer time frame chart shows that the trend returned to strength over the last few weeks. Last week we saw a strong blue "Go" bar with price closing at the top of the weekly range, close to where it opened. Some might call this a dragonfly doji, having slightly bullish implications. Since finding support at the zero level, GoNoGo Oscillator has continued to climb into positive territory now at a value of 3. Momentum is firmly on the side of the "Go" trend. We will look for price to make an attempt at a new high in the coming weeks.
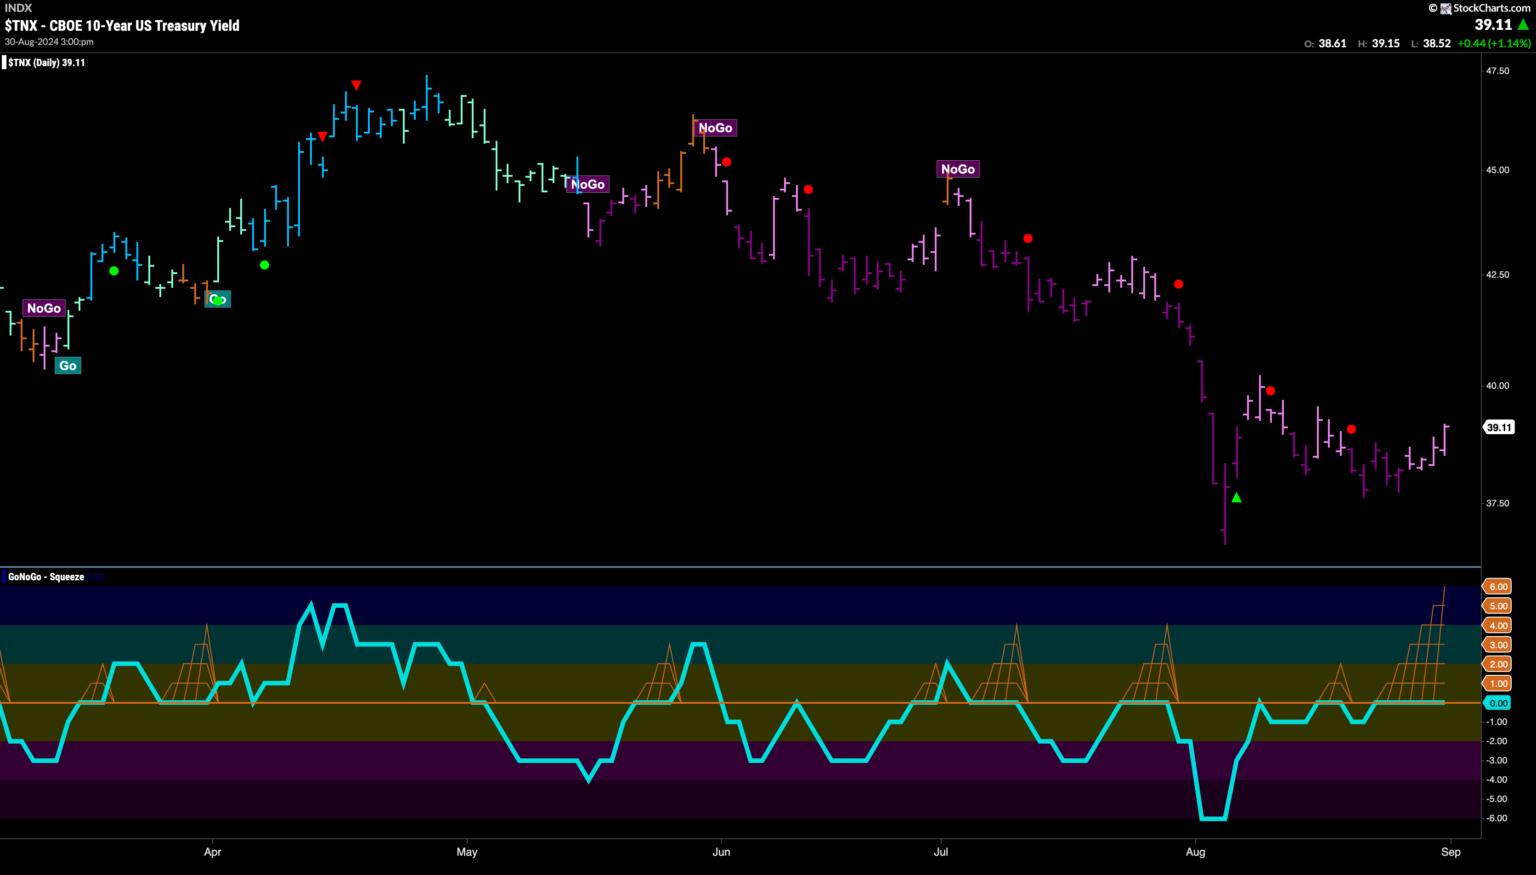
Treasury Yields Paint Weaker "NoGo" Trend
Treasury bond yields remained in a "NoGo" trend this week but the GoNoGo Trend indicator painted a string of weaker pink bars. We can see this happened after an inability to set a new lower low. GoNoGo Oscillator is riding the zero line as a Max GoNoGo Squeeze is in place. It will be important to note the direction of the Squeeze break to determine the next direction for yields.
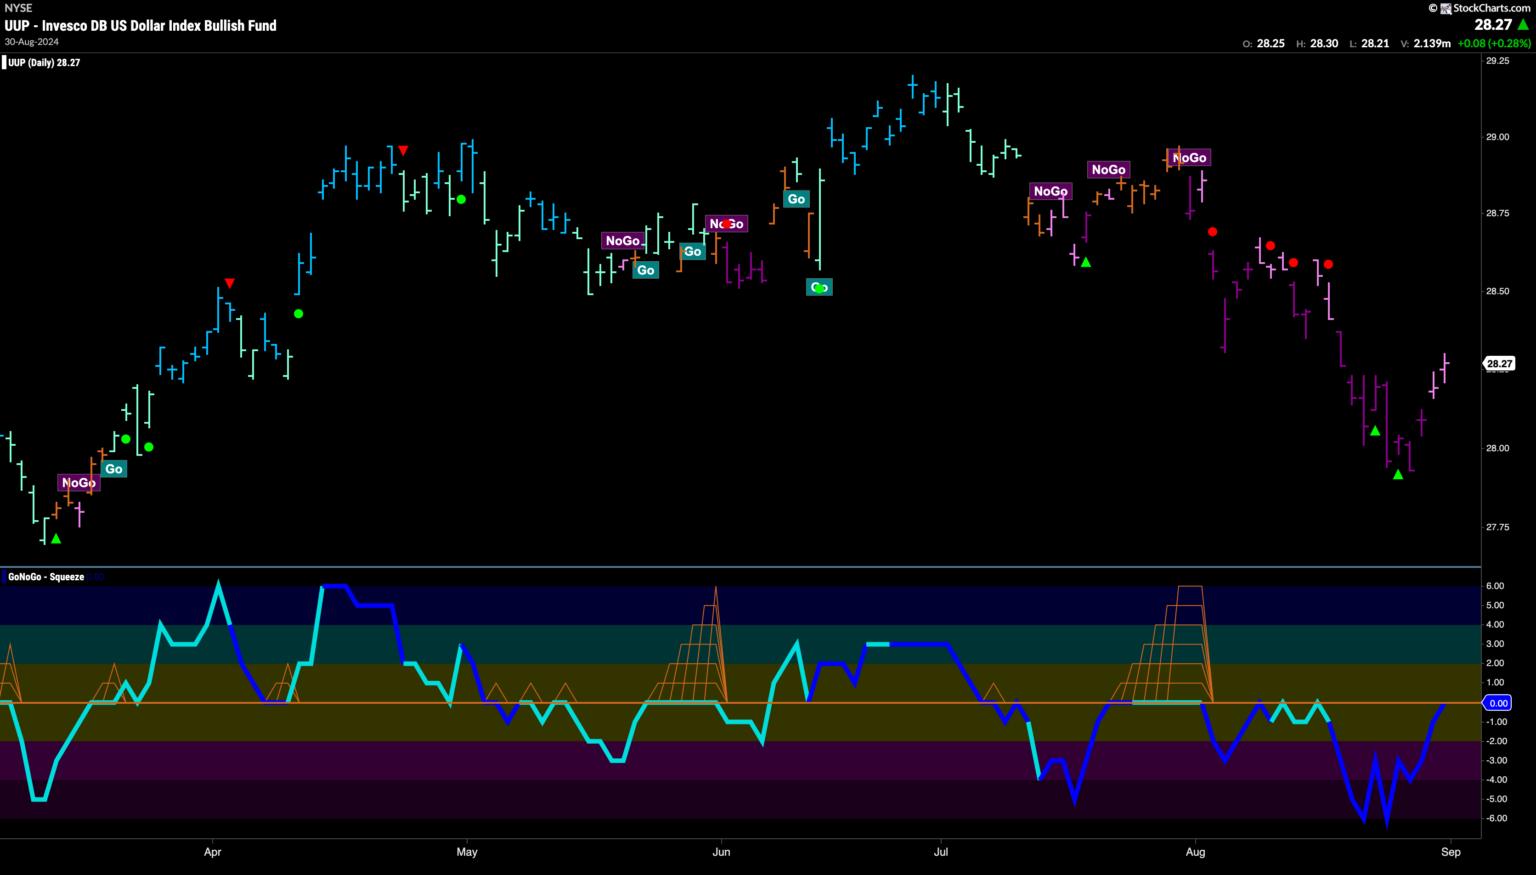
The Dollar's "NoGo" Weakens
After a strong lower low we see the dollar rallied into the end of the week and GoNoGo Trend painted weaker pink "NoGo" bars. GoNoGo Oscillator has risen sharply to test the zero line from below and we see heavy volume at these levels. We will watch to see if the Oscillator finds resistance at the zero line and if it gets turned away back into negative territory we will expect NoGo Trend Continuation.