In our previous Weekly note, we forecasted that the markets would not make any major headway in the truncated week due to the holiday festivities. As expected, the NIFTY spent the week in a narrow range and showed no directional bias. The benchmark index ultimately went nowhere, ending the week on a flat note while gaining 32.20 points (+0.31%) on a weekly basis.
 The previous week had just three full-working days if we discount Wednesday’s one-hour Mahurat Trading session. (Mahurat Trading session is a one-hour trading session that results in an official settlement. It is conducted as per auspicious Indian timings during Diwali which also marks the last trading day of the year and also marks the beginning of Hindu New Year). Still, the NIFTY traded much on technically analyzed lines and could not breach the 10600-10750 zones, an important resistance area.
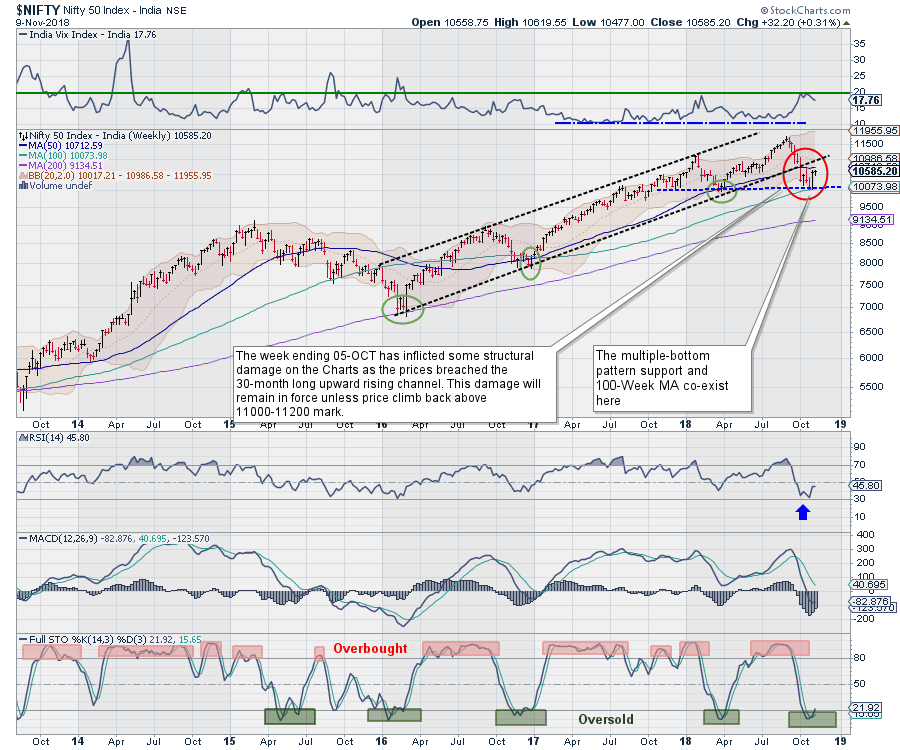
In the coming week, we continue to expect the zones of 10600-10750 to pose stiff resistance to the markets. Unless the NIFTY effectively moves past this 150-point resistance area, this range is likely to prove to be turbulent for the Markets. Multiple resistances appear in this area. A falling trend line on the Daily Chart, 50-Week Moving Average at 10712 and a 200-Day Moving Average at 10762 all fall within this 150-points range.
Next week, therefore, is likely to see resistance at the 10700 and 10825 levels. Supports are expected to come in at 10510 and 10415.
The Weekly RSI, which is currently at 45.8021, is neutral and shows no divergence against the price. The Weekly MACD remains bearish as it continues to trade below its signal line. A Spinning Top emerged on the candles. However, given the fact that we had a truncated week due to holidays, such formation holds little or no significance in the present technical set-up.
NIFTY has taken a triple bottom support in the 10000-10070 area after a fierce corrective decline that it witnessed over past couple of weeks. Markets rallied from these levels, but the pullback stalled in the 10600-10650 area. In the coming week, we will continue to see NIFTY struggling with this 150-point resistance zone.
The markets are seen consolidating near the current levels and have not shown any corrective decline. This, in a way, shows some internal strength, but we do not expect any meaningful up move to occur unless NIFTY moves past the 10750-mark. Until this happens, we will continue to see markets remaining jittery at higher levels. While taking shorts may be avoided, fresh purchases may be done while remaining highly selective and maintaining a cautious view on the Markets.
More emphasis is required on protecting profits with each up move until the 10750 level is taken out.
Sector Analysis for the Coming Week
In our look at Relative Rotation Graphs, we compared various sectors against CNX500, which represents over 95% of the free float market cap of all the stocks listed.
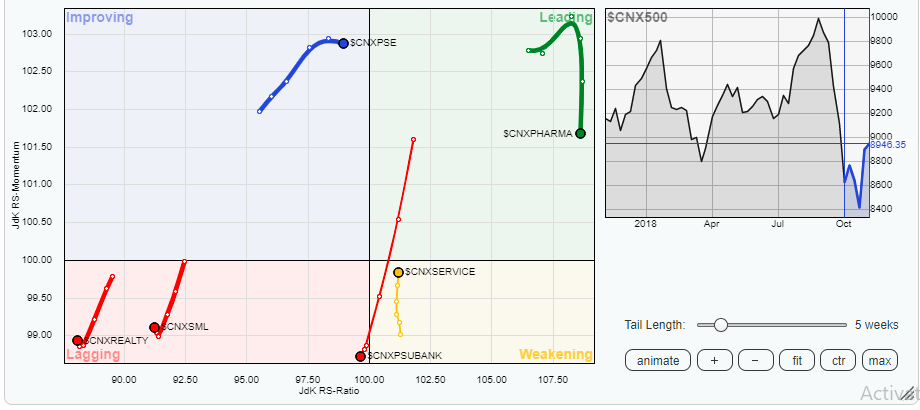
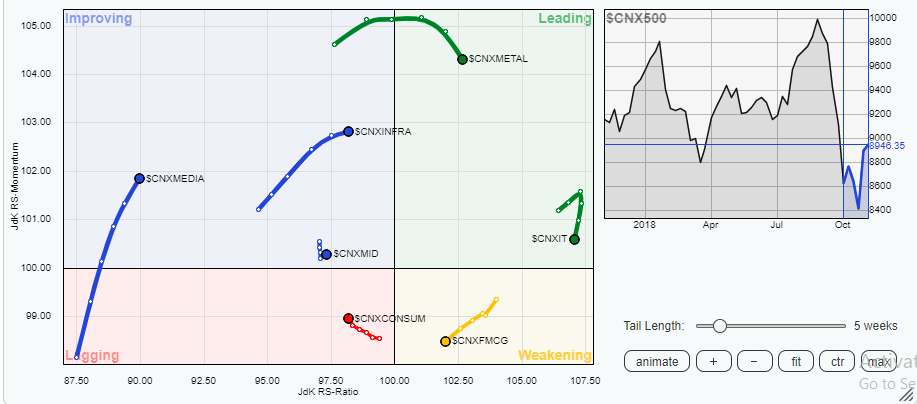
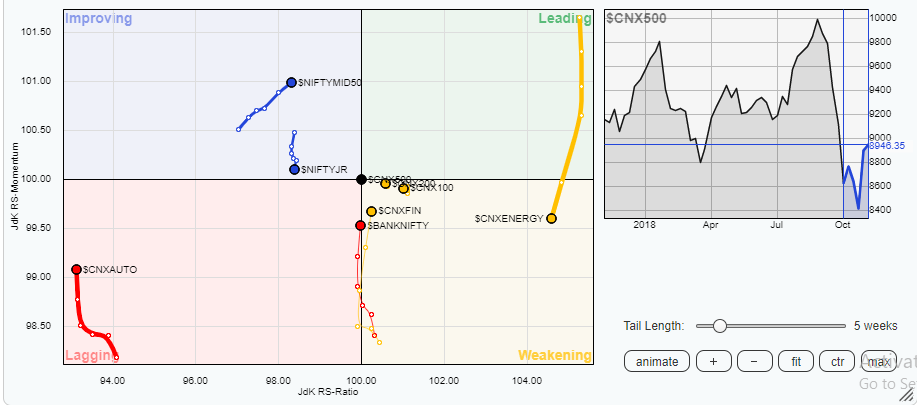
While inspecting the Relative Rotation Graphs (RRG), it is notable that, though Pharma and Metal Index remain in the leading quadrant, they appear to be stalling their up move as they show a minor loss of momentum. The IT Index also shows some loss of momentum despite remaining in the leading quadrant. Some strong sector rotation is seen in Infra and Media stocks, along with NIFTY MID50 Index. They are seen remaining resilient to any downsides and are also improving their relative momentum. So, while Pharma and Metal stocks may relatively out-perform the broader markets or consolidate at higher levels, Infra, Media and Midcaps are expected to show resilience in coming week while showing stock-specific out-performance. Financial Services stocks and BankNifty are also seen improving their relative momentum, despite remaining in the weakening and lagging quadrant respectively. Energy Index is seen slipping further in the weakening quadrant. FMCG, Auto, PSU Banks and Consumption stocks are not expected to put up any major performance in the coming week.
Important Note: RRG™ charts show you the relative strength and momentum for a group of stocks. In the above chart, they show relative performance as against the NIFTY500 Index (Broader Markets) and should not be used directly as buy or sell signals.
Milan Vaishnav, CMT, MSTA
Consulting Technical Analyst
www.EquityResearch.asia


