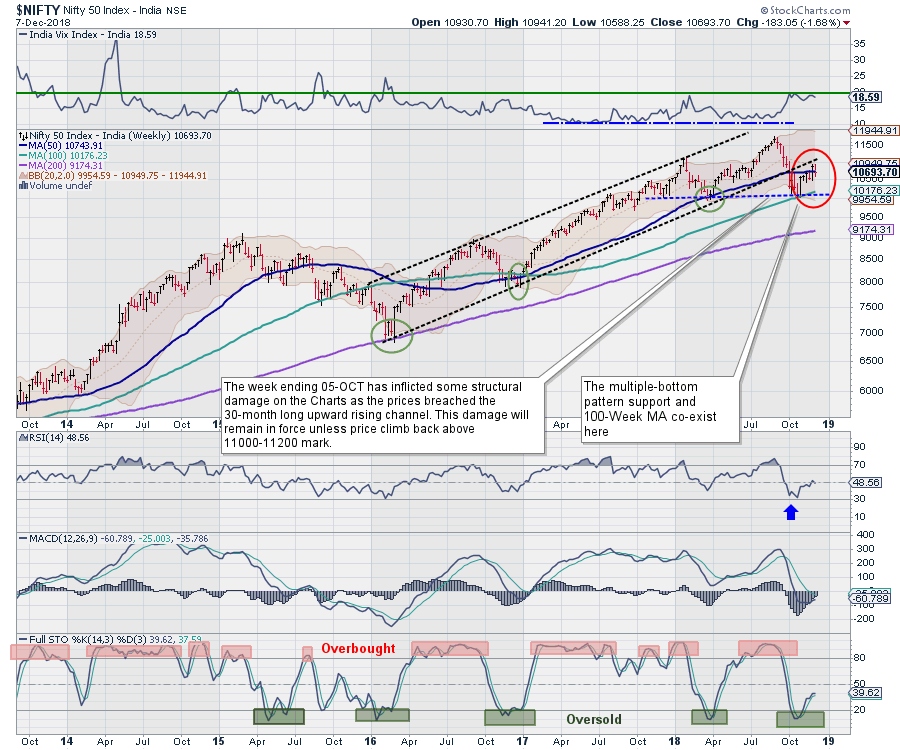
It wasn't smooth sailing for the equity markets as the previous week remained quite volatile, with the markets oscillating both ways to finally end the week in the red. The benchmark index NIFTY50 had moved past its 50-Week MA earlier, but it has failed to sustain that level. On weekly basis, the index ended with net loss of 183.05 points (-1.68%).
 The coming week is set to remain action packed; the trade set-up is a bit of a double-edged sword. If we look at the set-up solely from technical perspective, markets have a significant number of shorts that exist in the system. Friday’s trade saw shorts being covered; additionally, fresh longs were added, which usually indicates continuation of the uptrend that we saw on Friday. However, it would be the results of the key state elections that will dominate the markets. This will have its own sentimental impact - more so when these elections are viewed with reference to the coming Loksabha elections in 2019. Any negative outcome for the BJP will not be taken favorably by the markets.
Markets are likely to react to the Exit Polls, which forecast a fierce contest, and are likely to see a shaky start to the trade on Monday. We will see the Markets finding resistance at 10940 and 11010 while supports will come in at 10570 and 10480 zones. The range is likely to be wider in coming week. Volatility, too, is likely to remain ingrained in the trade.
The weekly RSI is 48.5600; it remains neutral and shows no divergence against the price. The weekly MACD is bearish, as it continues to trade below its signal line. No significant formation is seen on Candles.
Pattern analysis on the Weekly charts show that NIFTY has stalled its pullback while resisting the 20-Week MA. In the process, NIFTY has once again drifted below the 50-Week MA, which is presently at 10743. Importantly, if the NIFTY is not able to move past the level of 10940 in coming days, it can potentially mark a lower top at that level.
The Exit Polls forecast a close contest for the State Elections; this is set to keep the markets volatile. Slightest of the negative outcome for BJP is likely to dent the sentiment of the participants. The results of the current state slections and BJP’s performance is also being scrutinized, keeping the 2019 Loksabha elections in view. Given the structure of the Charts, we continue to recommend guarding profits at higher levels.
Even with the positive election outcome, the overhead pattern resistances will ensure that there will be no smooth sailing for the markets. The broader indexes like CNX100 and CNX200 remain in the weakening quadrant of the RRG, which is likely to adversely affect the breadth of the market.
All upsides should be used to protect profits. Downsides, if any, should be used in making defensive purchases on moderate levels.
Sector Analysis for the coming week
In our look at Relative Rotation Graphs, we compared various sectors against CNX500, which represents over 95% the free float market cap of all the stocks listed.

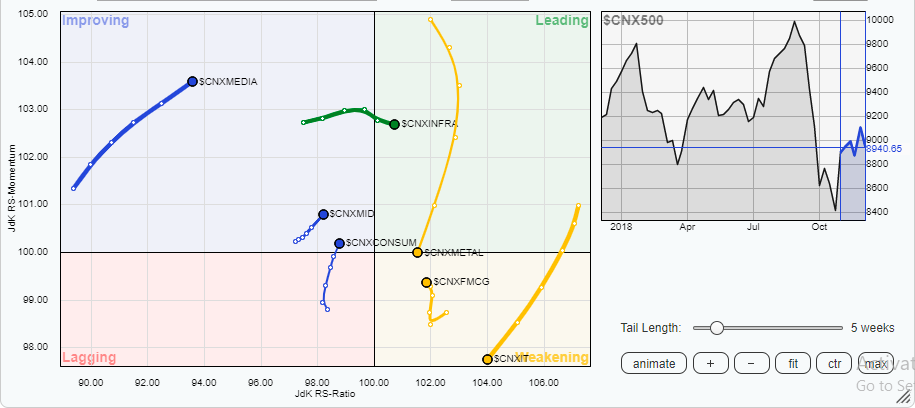
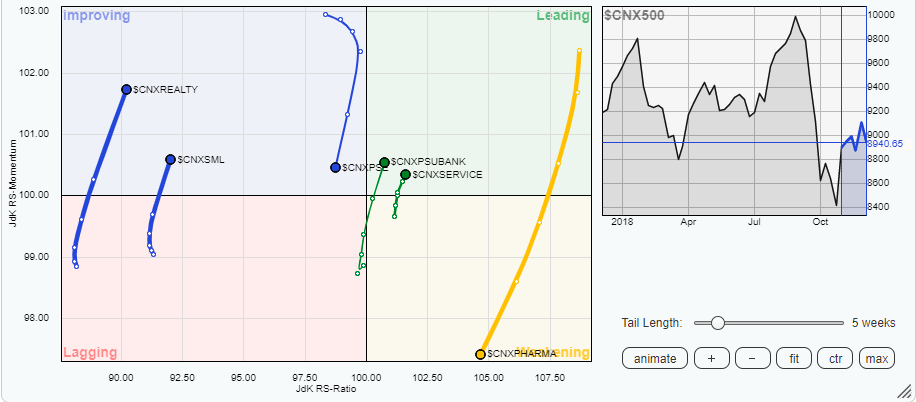 Study of the Relative Rotation Graphs (RRG) shows that PSU Banks and Service Sector Index have also entered the leading quadrant, joining the Bank Nifty and Financial Services Index, which are heading even higher on strong relative momentum. These four groups are set to show strong relative out-performance against the broader markets. The Infra Index has also entered the leading quadrant and it is set to join the group of relative out-performers against the broader markets. The Realty index, along with Media, Consumption and MidCaps have continued to show improvement in their relative momentum. Energy and IT Stocks have continued to lose relative momentum and they have moved lower in the weakening quadrant. Auto stocks have attempted to consolidate, which might result into some stock-specific isolated performance from this group. Metal stocks have shown some slowdown as well. The broader index like CNX100 and CNX200 remain in the weakening quadrant, which is likely to adversely affect the breadth of the market.
Important Note: RRG™ charts show you the relative strength and momentum for a group of stocks. In the above Chart, they show relative performance as against NIFTY500 Index (Broader Markets) and should not be used directly as buy or sell signals.
Milan Vaishnav, CMT, MSTA
Consulting Technical Analyst
www.EquityResearch.asia


