Lupin Limited (LUPIN.IN)
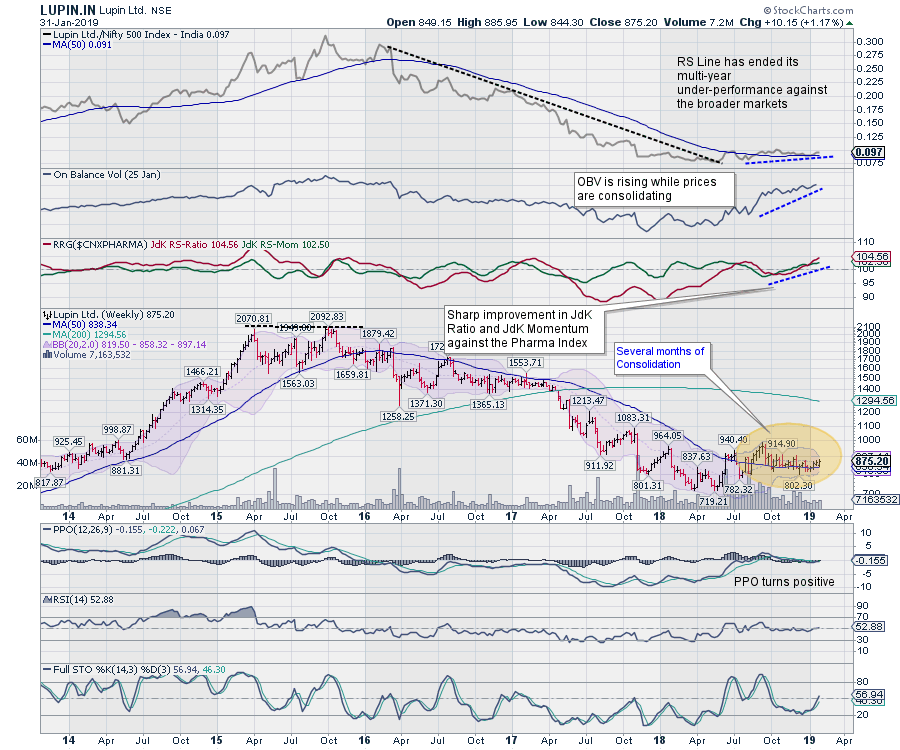
- LUPIN.IN marked a double top at the 2070-2092 level in October 2016 and has since remained in a corrective downtrend. After trading in a falling channel during this corrective phase and wiping out over 50% of its value, the stock has attempted to find a base in 780-860 range as part of an effort to reverse its multi-month downtrend.
- The RS Line, when compared against the broader CNX500 index, reflects a similar action, having ended its multi-year under-performance, flattened itself and begun moving up. As a confirmation of the reversal of its trend, the RS Line has moved above the 50-Week MA.
- This stock has also seen sharp improvement in its relative Ratio and Momentum when benchmarked against the CNXPharma index.
- On-Balance Volume (OBV) is considered the granddaddy of all volume indicators. It can be observed that while the stock was consolidating during the previous quarter, the OBV has been moving higher. This is a bullish signal.
- The chart shown above is a weekly chart; we have one trading day to go before the bar completes itself. That said, PPO has turned positive while weekly MACD has shown positive crossover, and this reading is unlikely to change by end of the week.
- The RSI has marked a 14-period high and shows bullish divergence against the price. Bullish divergence on RSI occurs when the RSI marks a 14-period high before the price. Price will usually follow this action.
- Additionally, the Bollinger bands are over 78% narrower than normal. While this suggests very low volatility compared to Lupin's normal range, the probability of a significant price move increases the longer the bands remain in this narrow range.
- If the price action evolves in the expected direction, the stock could potentially return ~14% from the present level of 875.20. Any move below 820 will be negative for the stock.
Milan Vaishnav, CMT, MSTA
Consulting Technical Analyst
www.EquityResearch.asia
Disclosure pursuant to Clause 19 of SEBI (Research Analysts) Regulations 2014: Analyst, Family Members or his Associates holds no financial interest below 1% or higher than 1% and has not received any compensation from the Companies discussed.

About the author:
Milan Vaishnav, CMT, MSTA is a capital market professional with experience spanning close to two decades. His area of expertise includes consulting in Portfolio/Funds Management and Advisory Services. Milan is the founder of ChartWizard FZE (UAE) and Gemstone Equity Research & Advisory Services. As a Consulting Technical Research Analyst and with his experience in the Indian Capital Markets of over 15 years, he has been delivering premium India-focused Independent Technical Research to the Clients. He presently contributes on a daily basis to ET Markets and The Economic Times of India. He also authors one of the India's most accurate "Daily / Weekly Market Outlook" -- A Daily / Weekly Newsletter, currently in its 18th year of publication.
Learn More


