The IT Pack remains firmly placed in the leading quadrant of the Relative Rotation Graph (RRG) as bench-marked against the broader CNX500 index. However, the IT index has relatively under-performed the front-line NIFTY over the past couple of days. With the NIFTY likely to take a breather and consolidate over the coming days, there is a possibility that we could see some IT stocks relatively out-performing the NIFTY. TCS is one such stock.
Tata Consultancy Services Ltd (TCS.IN)
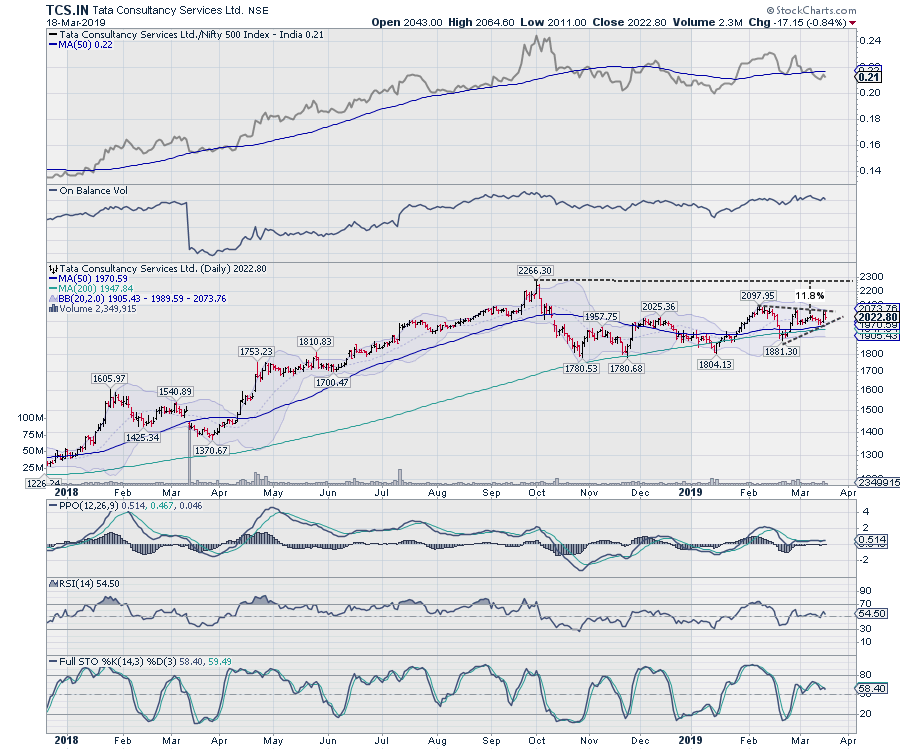
 TCS peaked near 2266 in late September 2018 and has since remained in a broad trading range. The price action over the past couple of days has resulted in the formation of a Symmetrical Triangle. If supported by other pieces of evidence, this pattern would act as a continuation pattern.
The daily and weekly MACD remain in continuing buy mode. On the higher timeframe charts, the OBV (On Balance Volume) has shown a sharp up move, which is a bullish sign. The RS Line remains in a firm uptrend on the higher timeframe charts.
If the present pattern results in an up move, the stock can return ~11% from the present price level of 2022. Any price action below 1940 will be negative for the stock.
Milan Vaishnav, CMT, MSTA
Consulting Technical Analyst
www.EquityResearch.asia
Disclosure pursuant to Clause 19 of SEBI (Research Analysts) Regulations 2014: Analyst, Family Members or his Associates hold no financial interest below 1% or higher than 1% and have not received any compensation from the Companies discussed.


