The markets fared much along the expected lines over the past five sessions. In the previous weekly note, we had mentioned that if the NIFTY failed to move past the previous week's high, it might end up forming a lower top for itself. Things turned out on the anticipated lines; the 11-year old trend line proved to be too stiff a resistance to move past for the markets. The headline index, NIFTY50, retraced from the levels that it had scaled a week before and ended with a net loss of 608.40 points (-6.17%) on a weekly note, giving up the most of its previous week's gains.
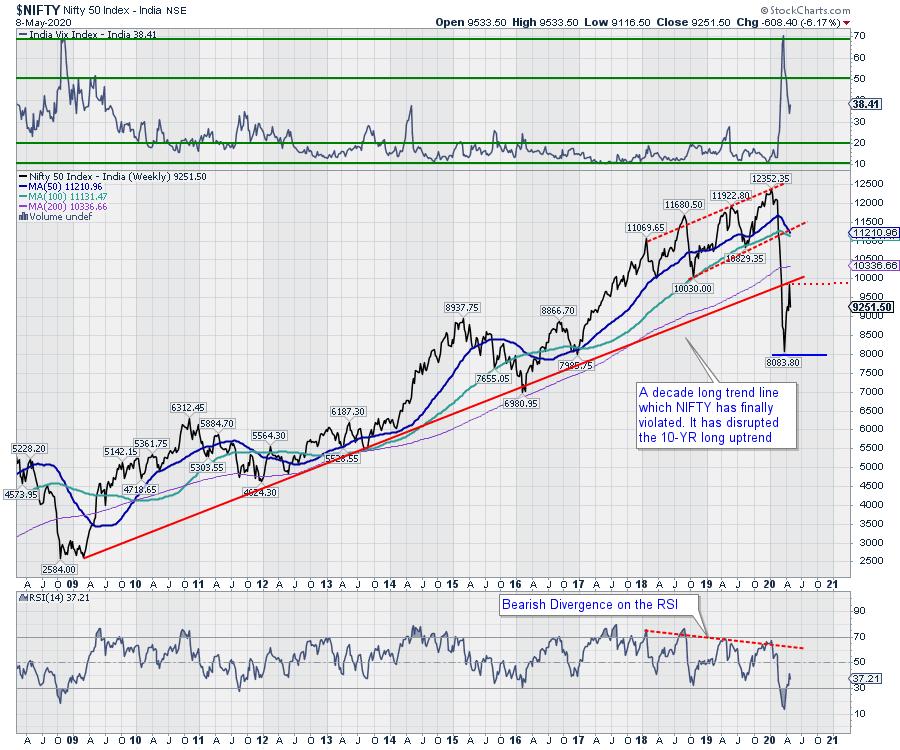
From a technical perspective, the NIFTY coming off from the decade-old upward rising trend line is a significant technical event. The trend line was very crucial support, and the Index retracing from that point has reinforced that trendline as a major pattern resistance for the markets, which has resulted in the formation of a lower top. The India Volatility Index, INDIAVIX, surged by 13% to 38.41 as compared to the previous week.
The coming week is expected to see the levels of 9430 and 9495 acting as strong resistance points. The supports come in at the 9130 and 9000 levels.
The weekly RSI is 37.21; it remains neutral and does not show any divergence against the price. The weekly MACD is bearish as it trades below its signal line. A black body emerged on the candles. Apart from this, no other vital formations are seen on candles.
The pattern analysis highlights the importance of the multi-year long upward rising trend line. The NIFTY had violated this decade-old trend line on its way down. Now, on the expected lines, this trend line has turned into a strong resistance point. The NIFTY halting its technical pullback near this point eventually led to the formation of a lower top for the markets.
All in all, despite the likelihood of the markets enjoying some mild intermittent pullbacks, we reiterate the wisdom of not chasing such up moves, if at all there are any, but keep using them to protect profits wherever possible. The upside potential of the markets will remain capped, and the Index will turn vulnerable again near the 9450-9500 zones. We strongly suggest continuing to stay highly stock-specific while approaching the markets on a defensive note.
Sector Analysis for the Coming Week
In our look at Relative Rotation Graphs®, we compared various sectors against CNX500 (NIFTY 500 Index), which represents over 95% of the free float market cap of all the stocks listed.
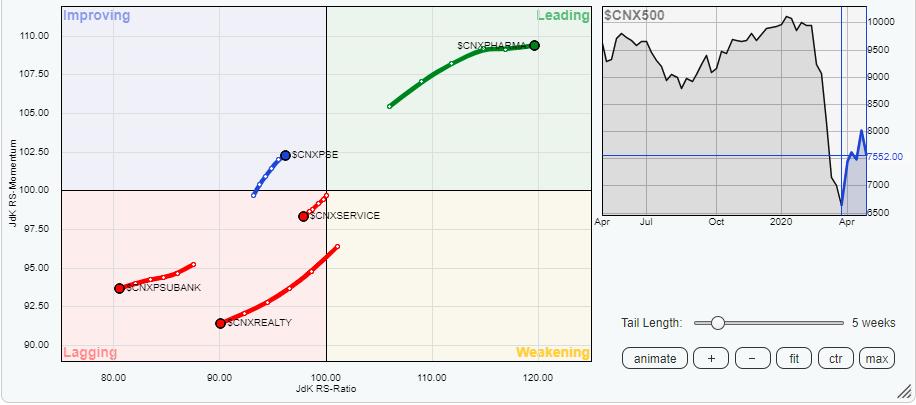
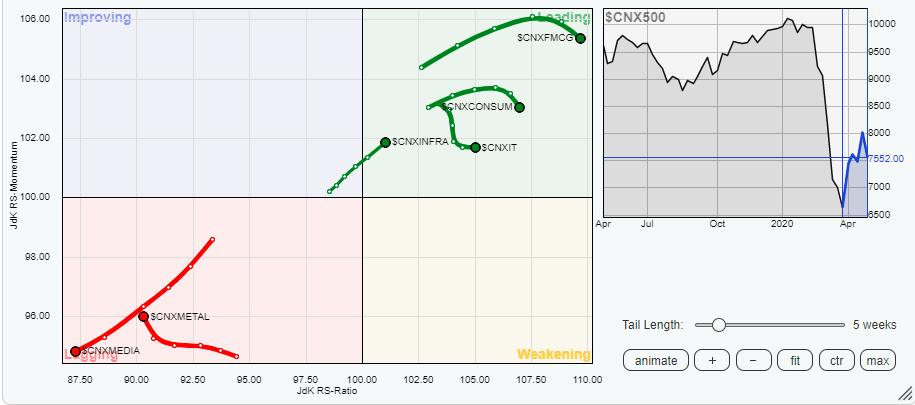
The review of Relative Rotation Graphs (RRG) highlights the need for continuing adopting the defensive approach in the markets. The Pharma, FMCG and the Consumption Indexes, along with the IT Index, are placed in the leading quadrant. Some minor flip of relative momentum is seen in these indexes, but they will broadly continue to outperform the broader markets on a relative basis. Along with these four groups, the NIFTY Infrastructure index is also in the leading quadrant, which is expected to continue to relatively outperform against the broader NIFTY 500 index.
The NIFTY Infrastructure index, despite being in the leading quadrant, is nearer to the center point as compared to the Pharma, FMCG and Consumption. So it is likely that it may offer less alpha as compared to the other three indexes.
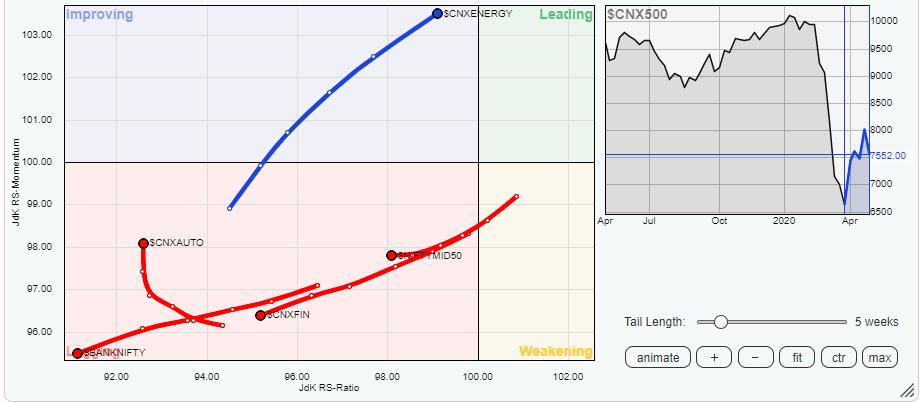
The Energy, Commodities, and the PSE indexes are moving firmly in the improving quadrant. The Auto index, though it remains in the lagging quadrant, is seen fiercely attempting to consolidate its performance.
Other vital indexes like PSU Banks, BankNIFTY, Metals, Media, the Services sector, Financial Services and Realty appear to be consistently losing their relative momentum. They are placed in the lagging quadrant and are expected to underperform the broader markets relatively.
Important Note: RRG™ charts show the relative strength and momentum for a group of stocks. In the above chart, they show relative performance against NIFTY500 Index (Broader Markets) and should not be used directly as buy or sell signals.
Milan Vaishnav, CMT, MSTA
Consulting Technical Analyst,


